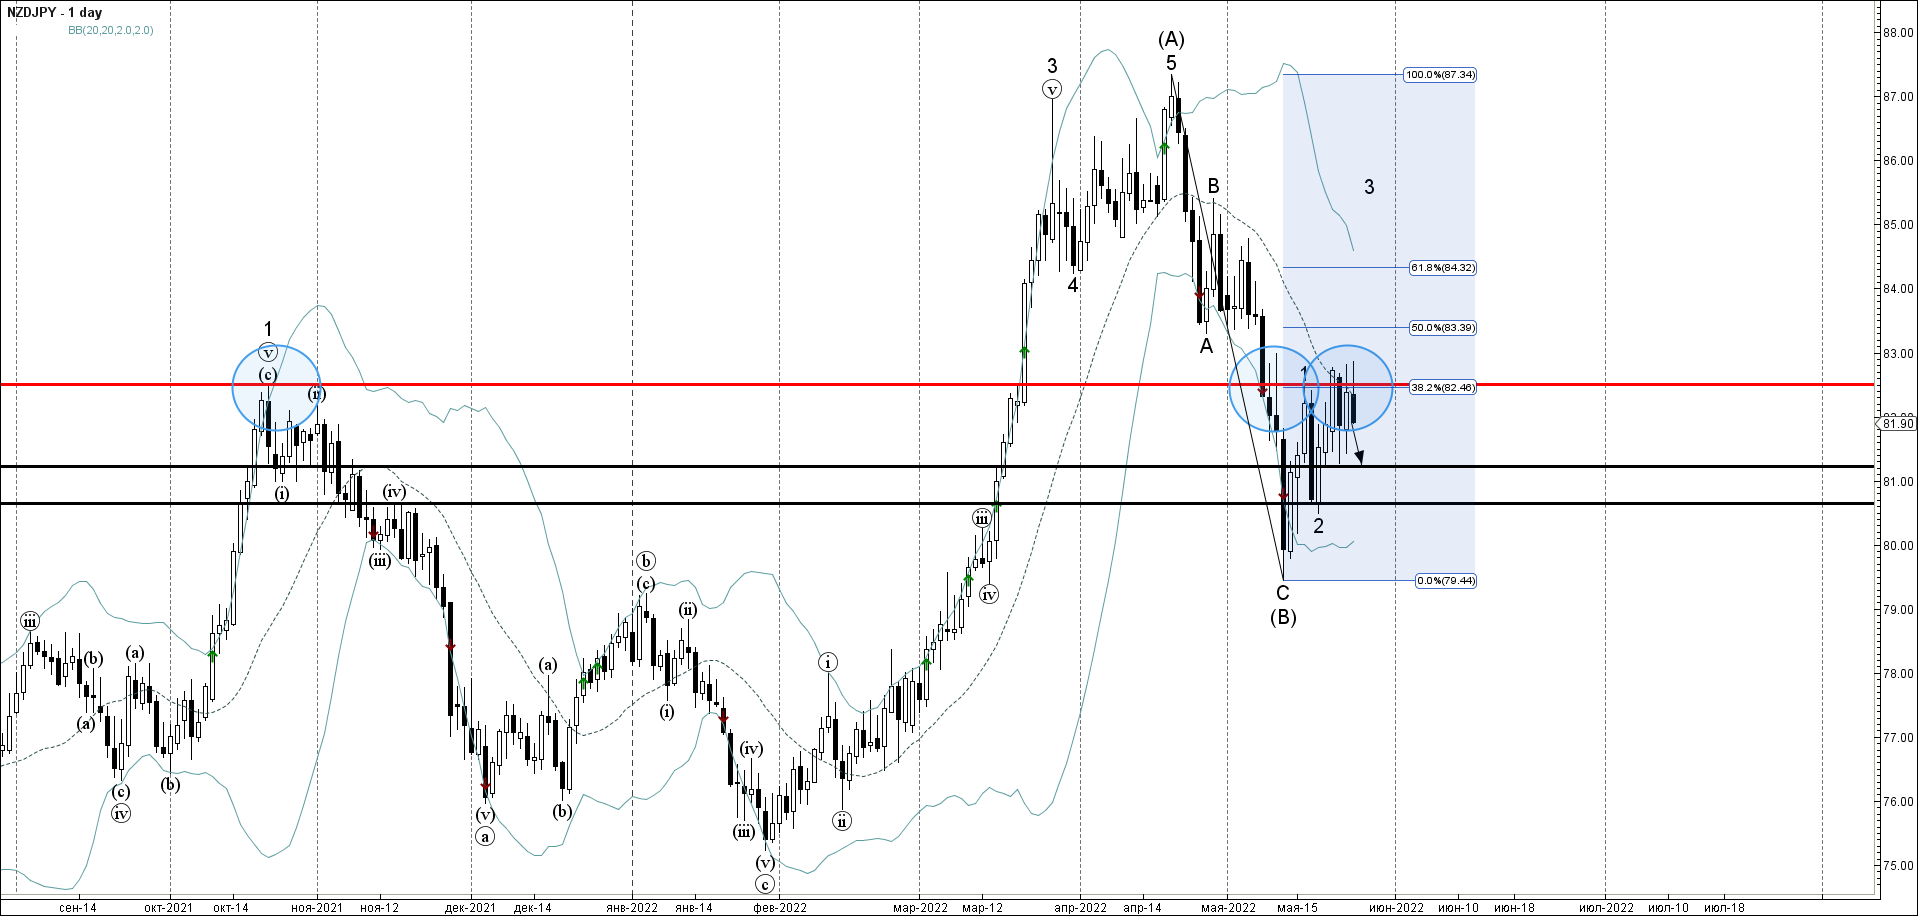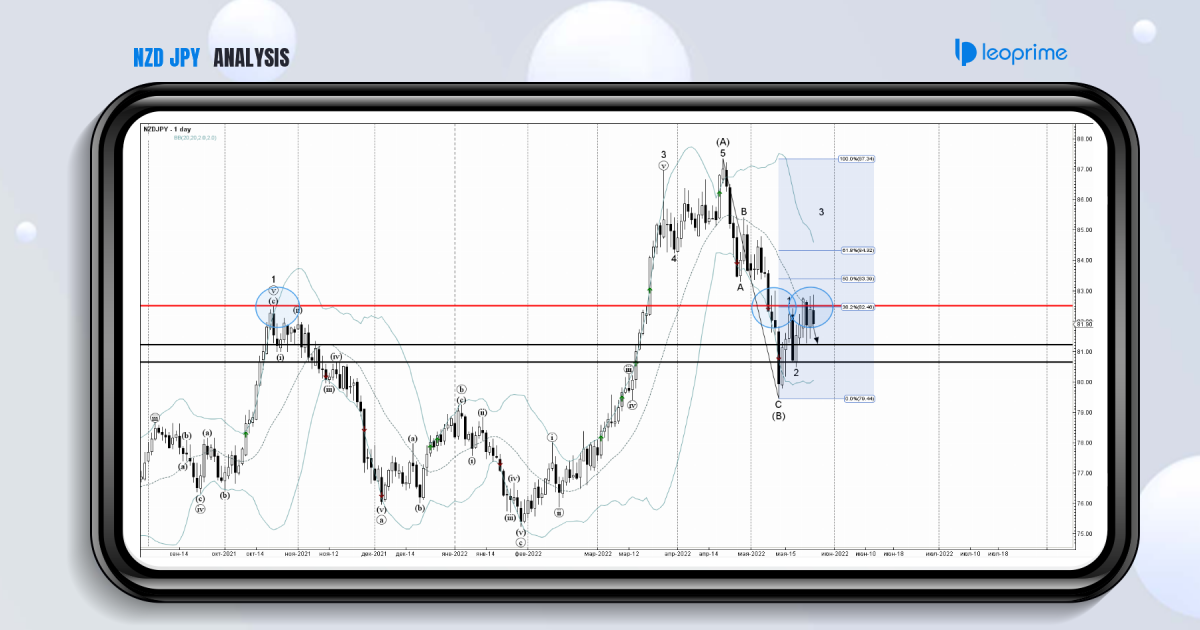
NZDJPY currency pair recently reversed down from the resistance zone located between the key resistance level 82.500 (former multi-month high from October), the upper daily Bollinger Band and the 38.2% Fibonacci correction of the earlier downward price impulse from the middle of April. The downward reversal from this resistance area stopped the earlier upward
impulse waves 3 and (C). Given the strength of the aforementioned resistance zone, NZDJPY can be expected to fall further toward the next support level 81.250.
NZDJPY reversed from resistance level 82.500; Likely to fall to support level 81.250.


