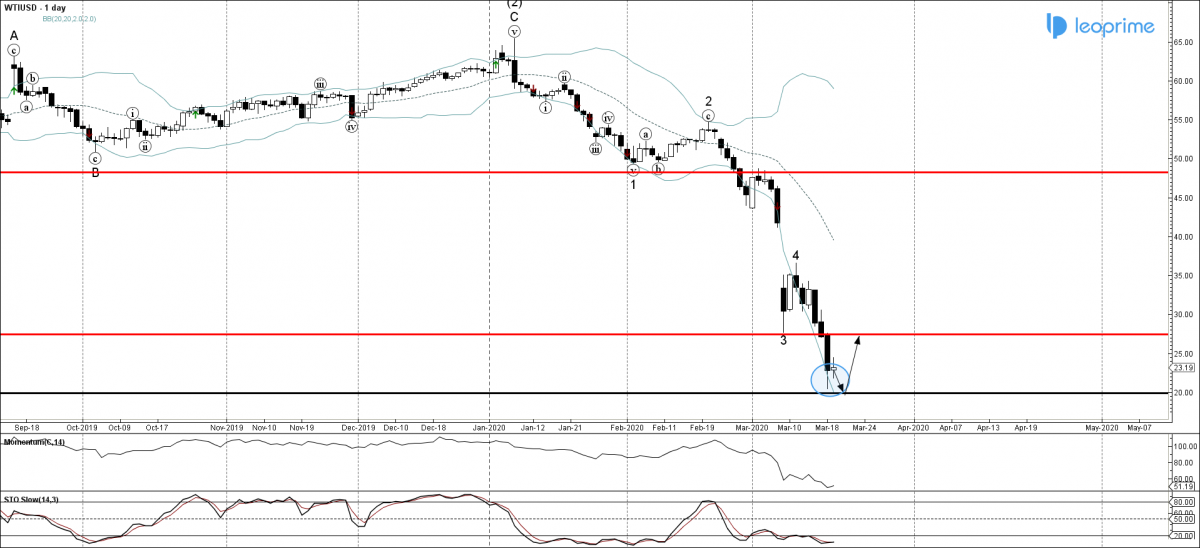
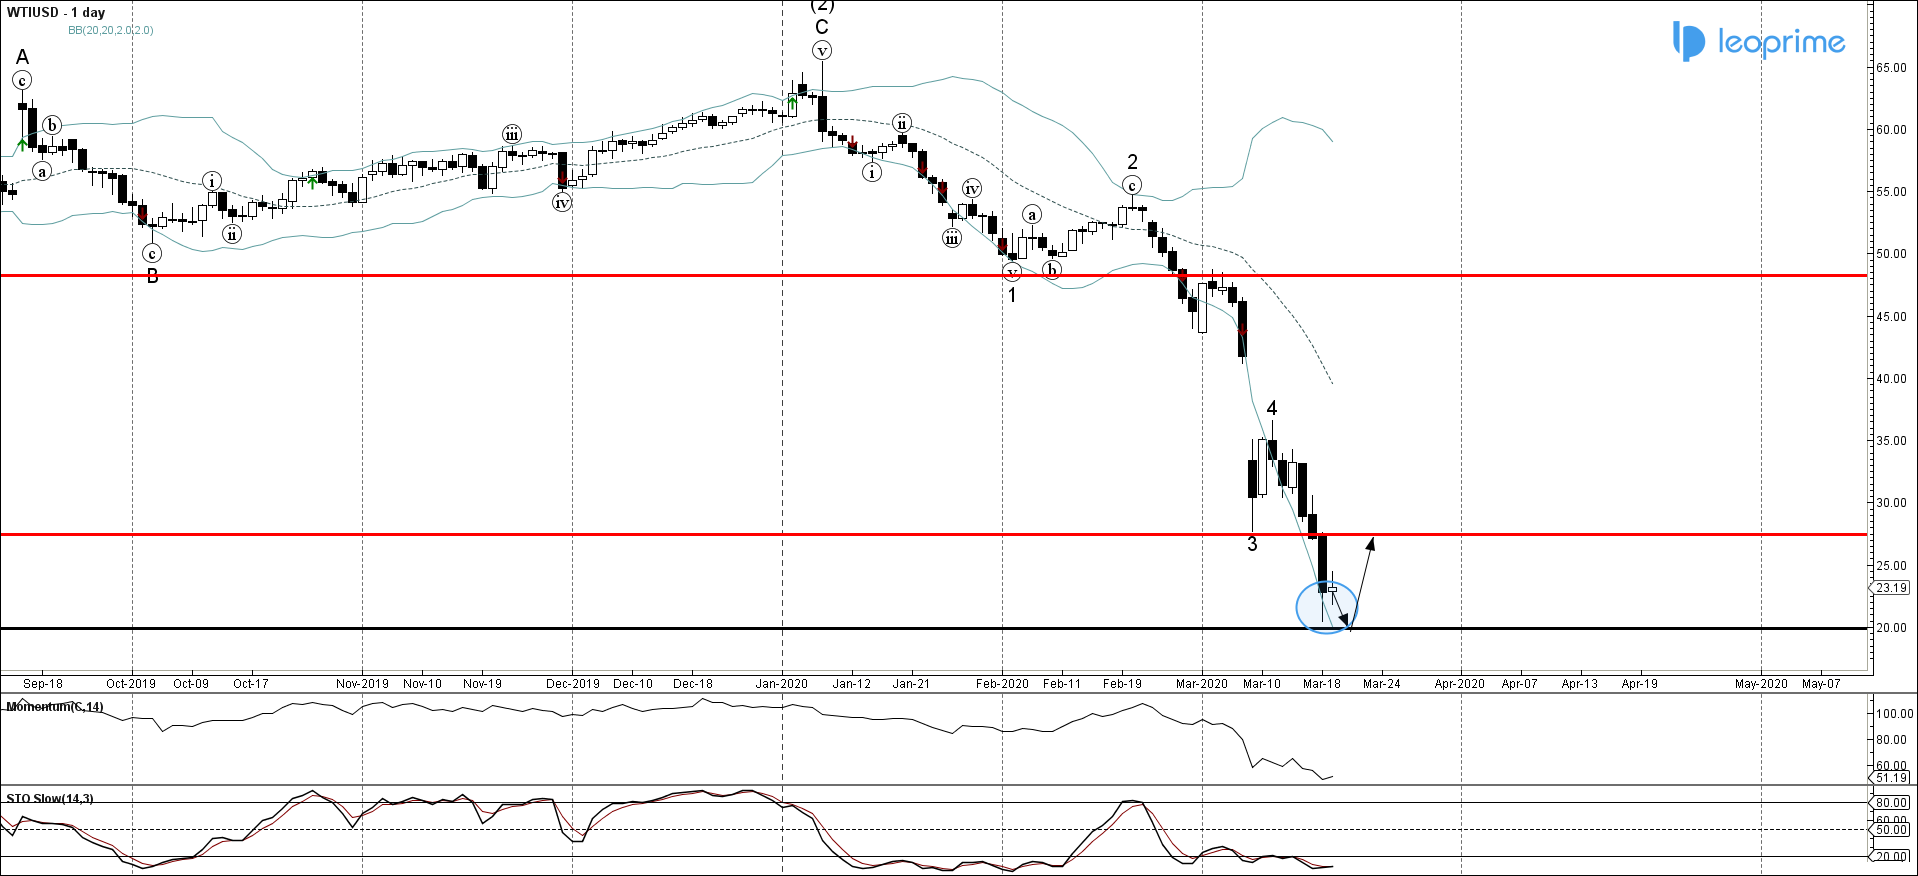
XTI recently reversed up from the support area lying between the key support level 20.00 and the lower daily Bollinger Band. The upward reversal from this support area reversed the earlier short-term impulse wave 5 from the start of March. Given the strength of the previous daily impulse wave – XTI might retest the support level 20.00 in the nearest time. Given the oversold reading on the daily Stochastic indicator and the overstretched daily Momentum – the price is likely to correct up to 27.40 (low of the earlier impulse wave 3) after reaching 20.00.
XTI approached key support level 20.00; Likely to rise to 27.40


