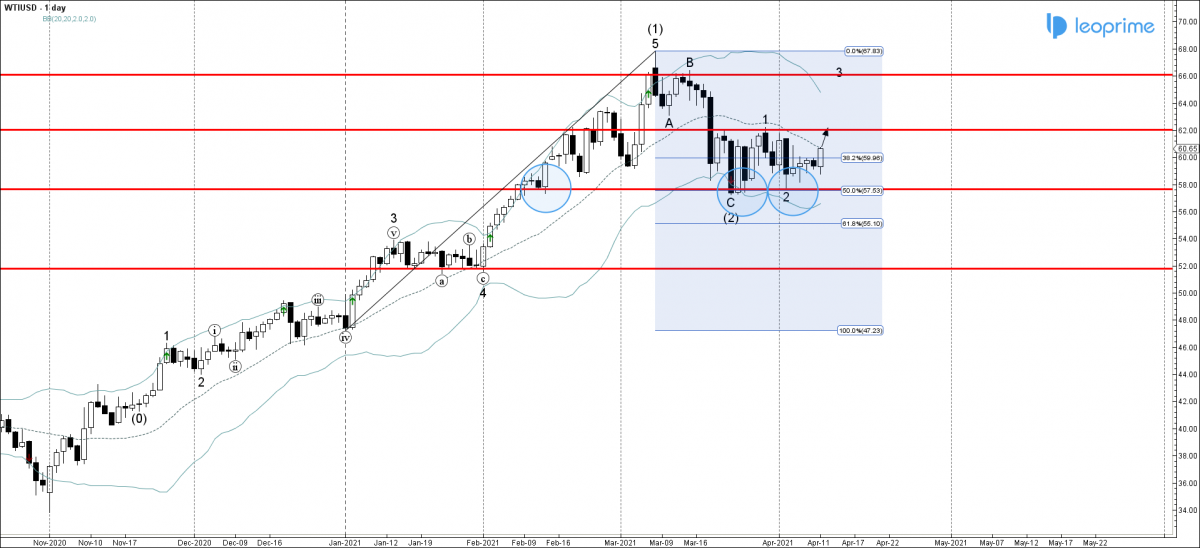
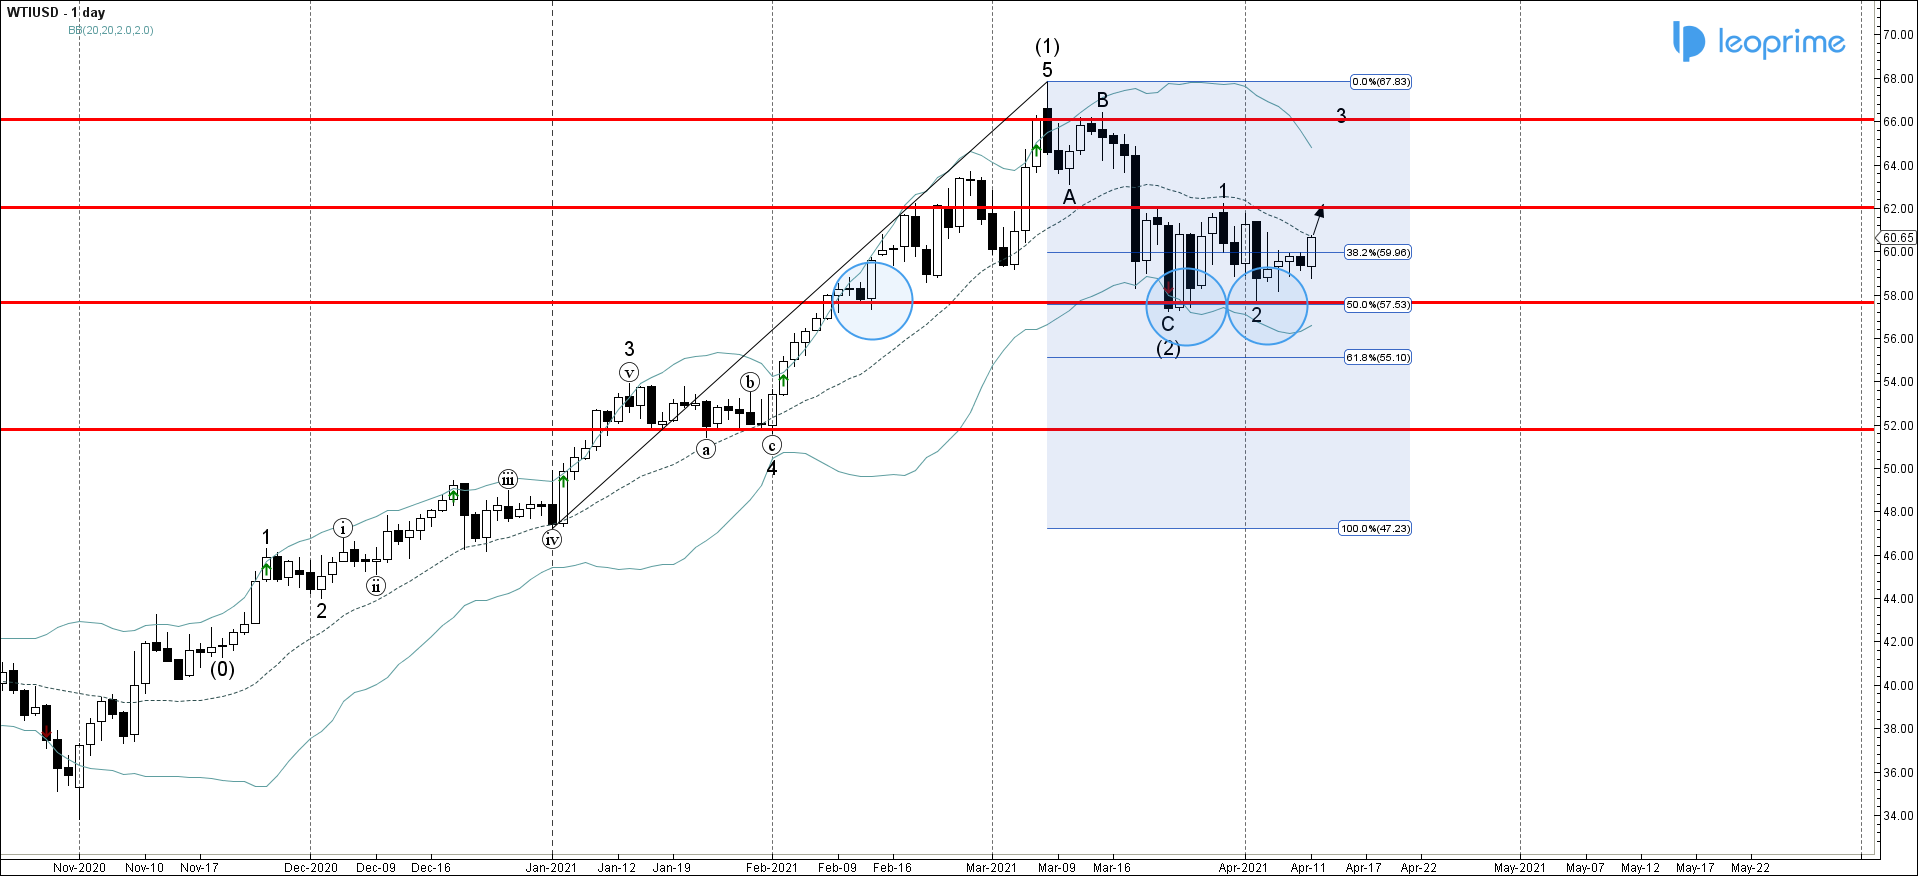
WTIUSD recently reversed up from the support area located between the pivotal support level 58.00 (which has been reversing the price from the middle of February, as can be seen from the daily WTIUSD chart below), lower daily Bollinger Band and the 50% Fibonacci correction of the previous upward impulse from the start of last January. Given the strength of the aforementioned support area and the improvement in the risk sentiment across the commodities markets today – WTIUSD can be expected to fall further toward the next resistance level (top of the previous minor impulse wave 1s).
WTIUSD reversed from support area; Likely to rise to resistance level 62.00.


