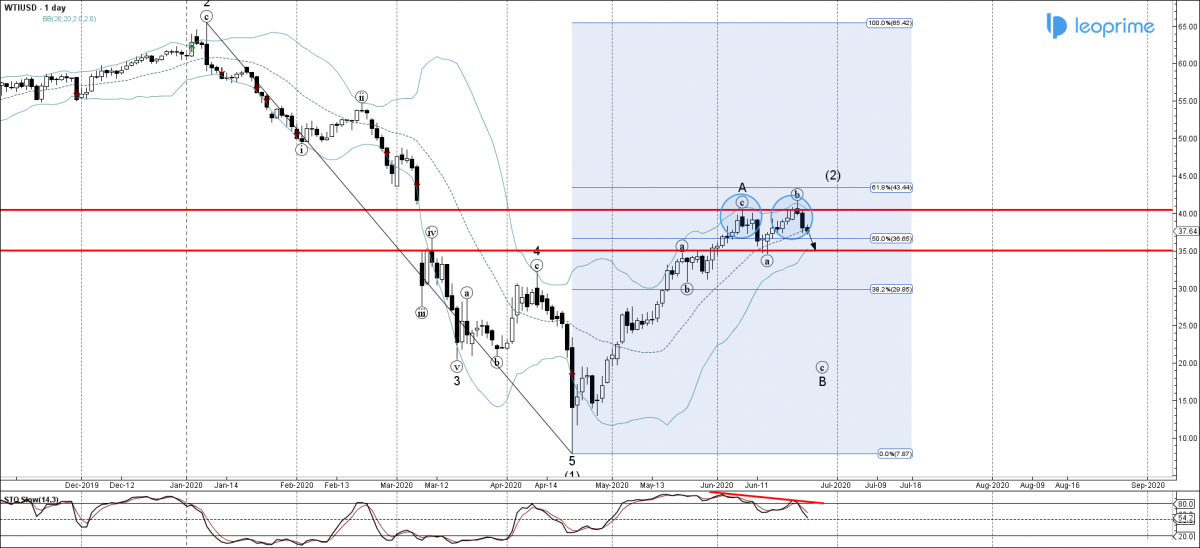
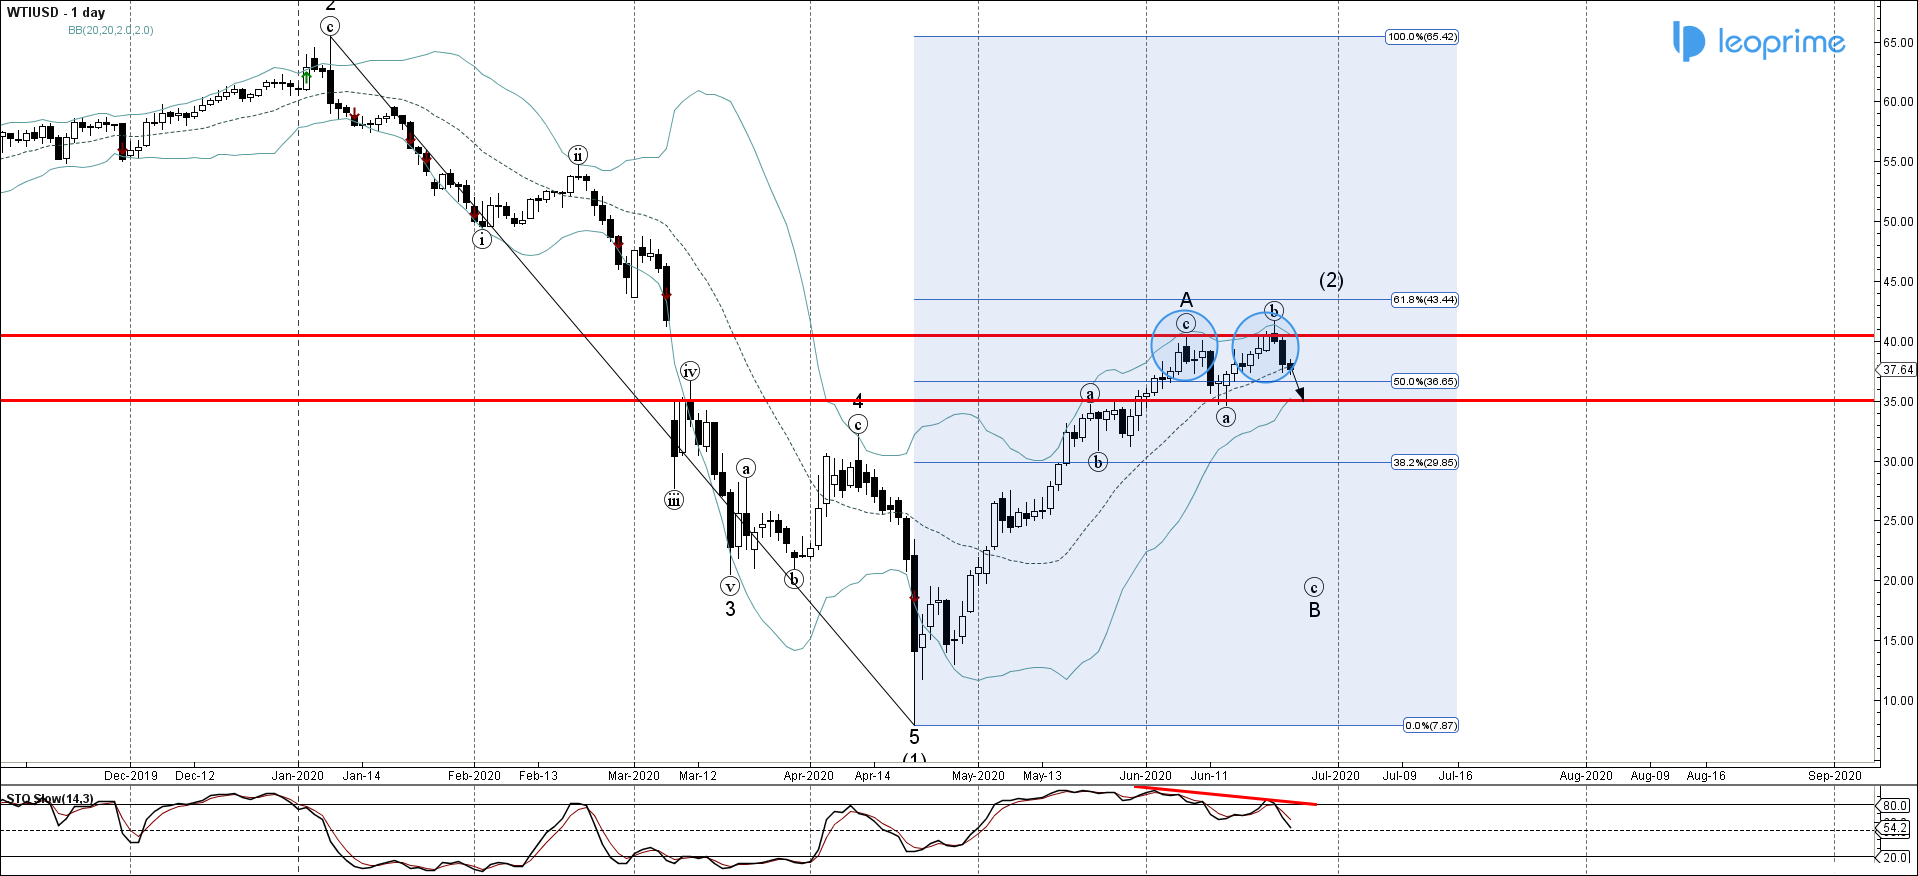
WTIUSD recently reversed down from the resistance zone located between the round resistance level 40.00 (top of the previous impulse wave A), upper daily Bollinger band and the 61.8% Fibonacci retracement of the previous multi-month downward impulse from the start of January. The downward reversal form the aforementioned resistance zone started the active impulse wave (c). Given the clear bearish divergence on the daily Stochastic indicator – WTIUSD is likely to extend the losses toward the next support level 35.20 (low of the previous short-term wave (a)).
WTIUSD reversed from round resistance level 40.00; Likely to fall to 35.20


