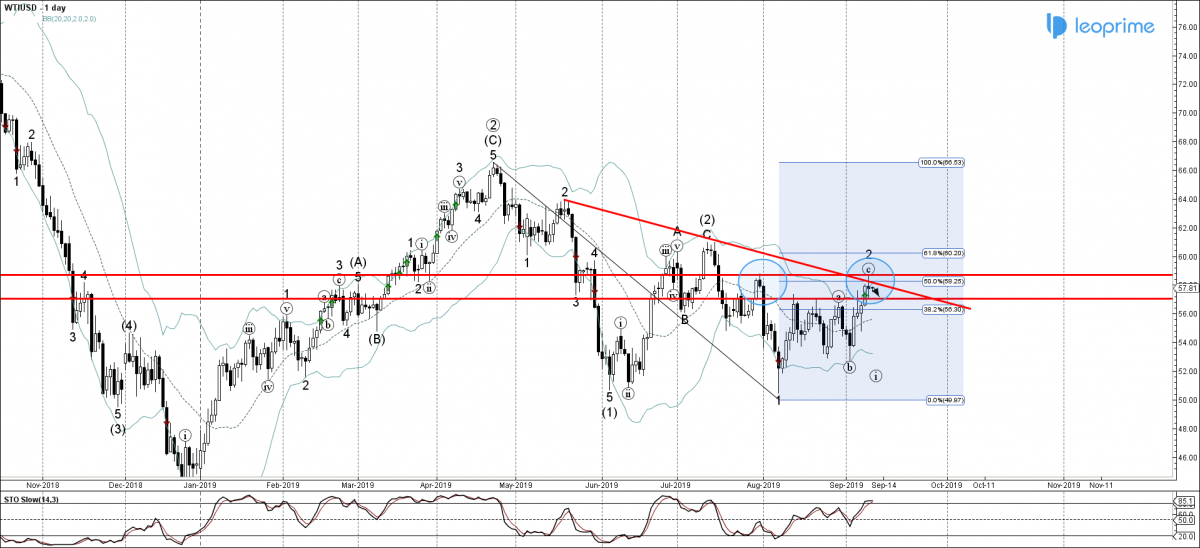
• WTI reversed from resistance level 58.70
• Possible downward correction to 57.00
WTI recently reversed down from resistance area lying between the resistance level 58.70 (top of the earlier correction from July), resistance trendline from May, upper daily Bollinger Band and 50% Fibonacci correction of the previous downward impulse wave from April.
With the daily Stochastic in the overbought area – WTI might correct down to retest the support level 57.00 (former resistance from August). In the opposite scenario WTI will test the nearby resistance level 58.70 – the breakout of which will strengthen the pressure on WTI and will lead to further gains toward the next resistance level 60.80 (top of the previous ABC correction (2)).


