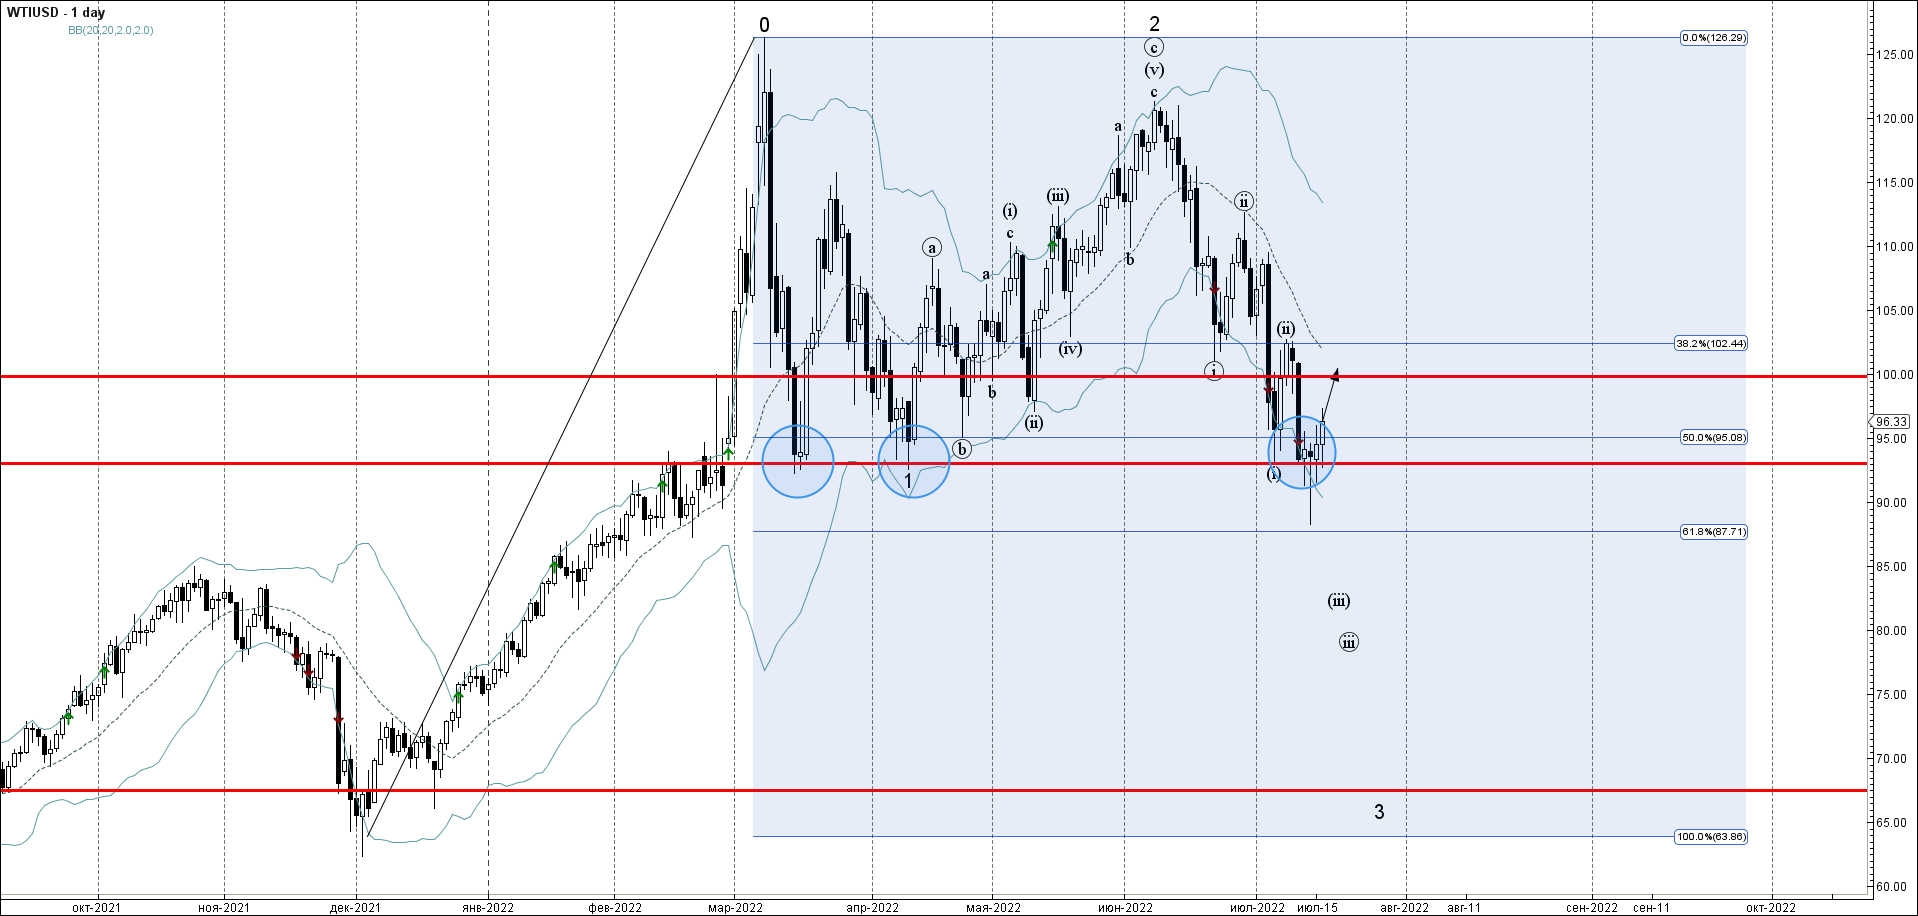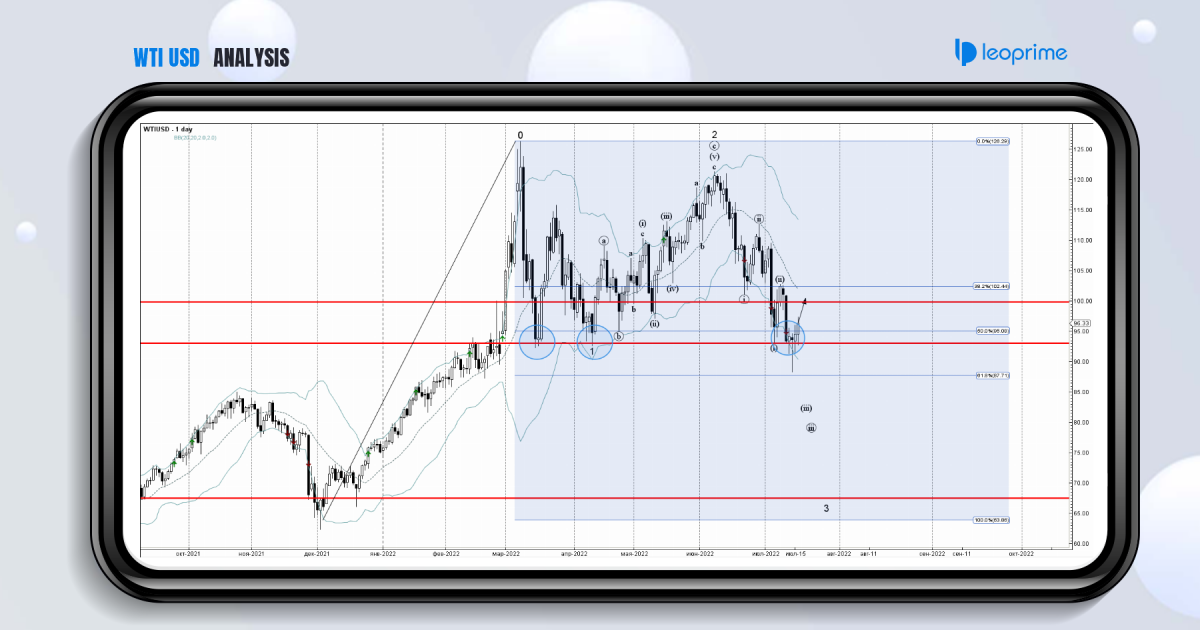
WTI crude oil recently reversed up from the key support level 93.000 (which has been repeatedly reversing the price from the middle of March), standing close to lower daily Bollinger Band and the 50% Fibonacci
correction of the upward impulse from December. The upward reversal from the support level 93.000 stopped the earlier impulse waves (iii) and 3.
Given the strongly bullish uptrend that can be seen on the daily WTI crude oil charts, the price can then be expected to rise further toward the next round resistance level 100.000.
WTI reversed from support level 93.000; Likely to rise to resistance level 100.000.


