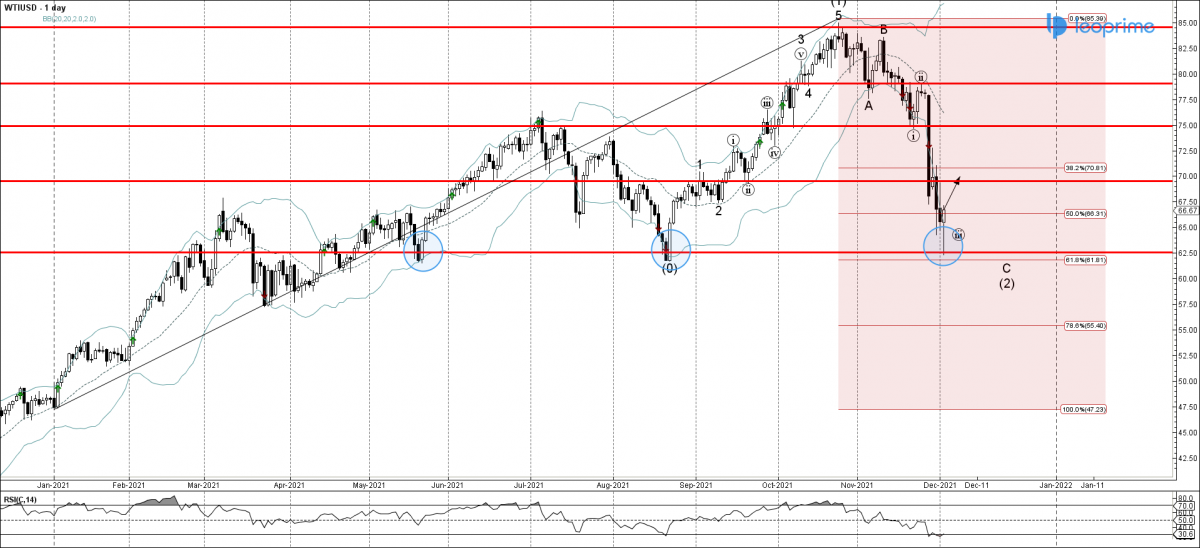
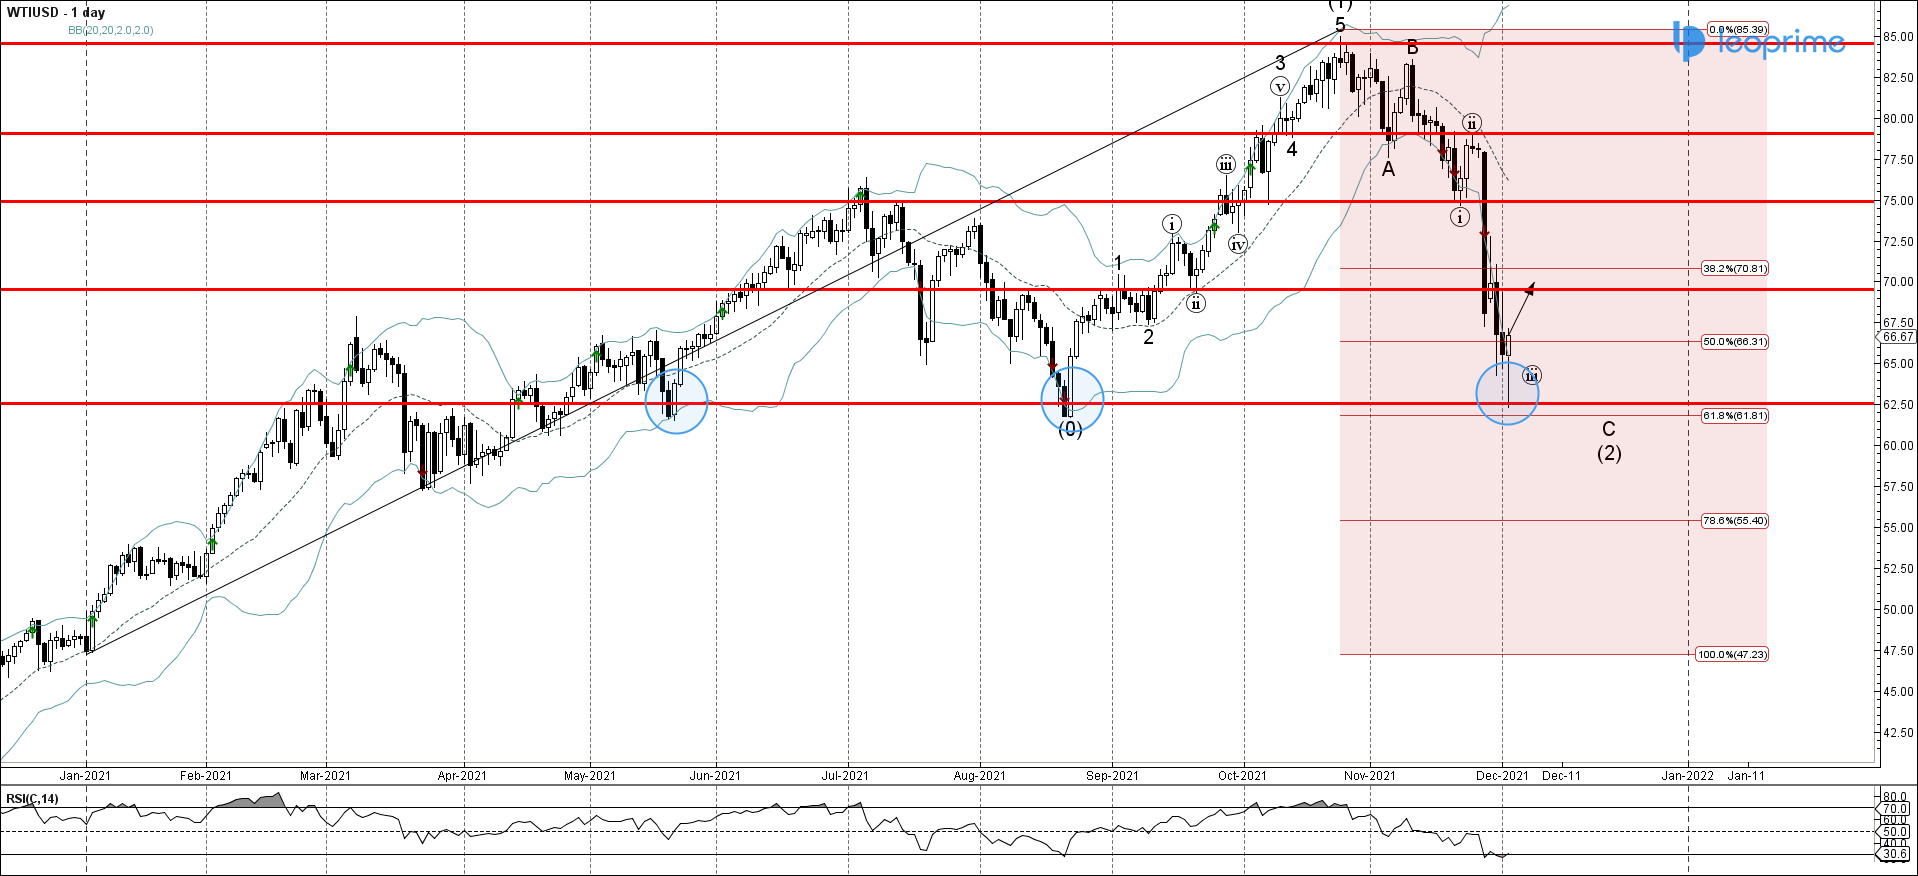
WTI crude oil reversed up with the daily Japanese candlesticks pattern Hammer from the support zone located between the long-term support level 62.50 (which has been reversing the price from May, as can be seen from the daily WTI chart below). 61.8% Fibonacci correction of the uptrend from January and the daily lower Bollinger Band. The upward reversal form this support zone stopped the previous ABC correction (2). Given the prevailing uptrend and the strength of the nearby support level 62.50 , WTI crude oil can be expected to rise further toward the next round resistance level 70.00 (low of wave (i) from last month).
WTI reversed from support area; Likely to rise to resistance level 70.00;


