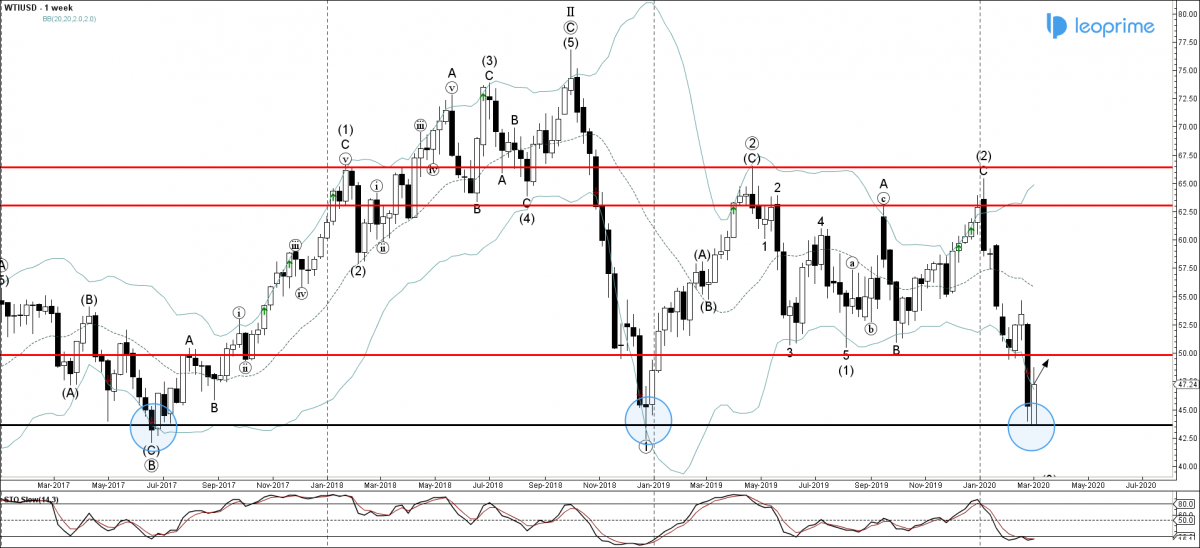
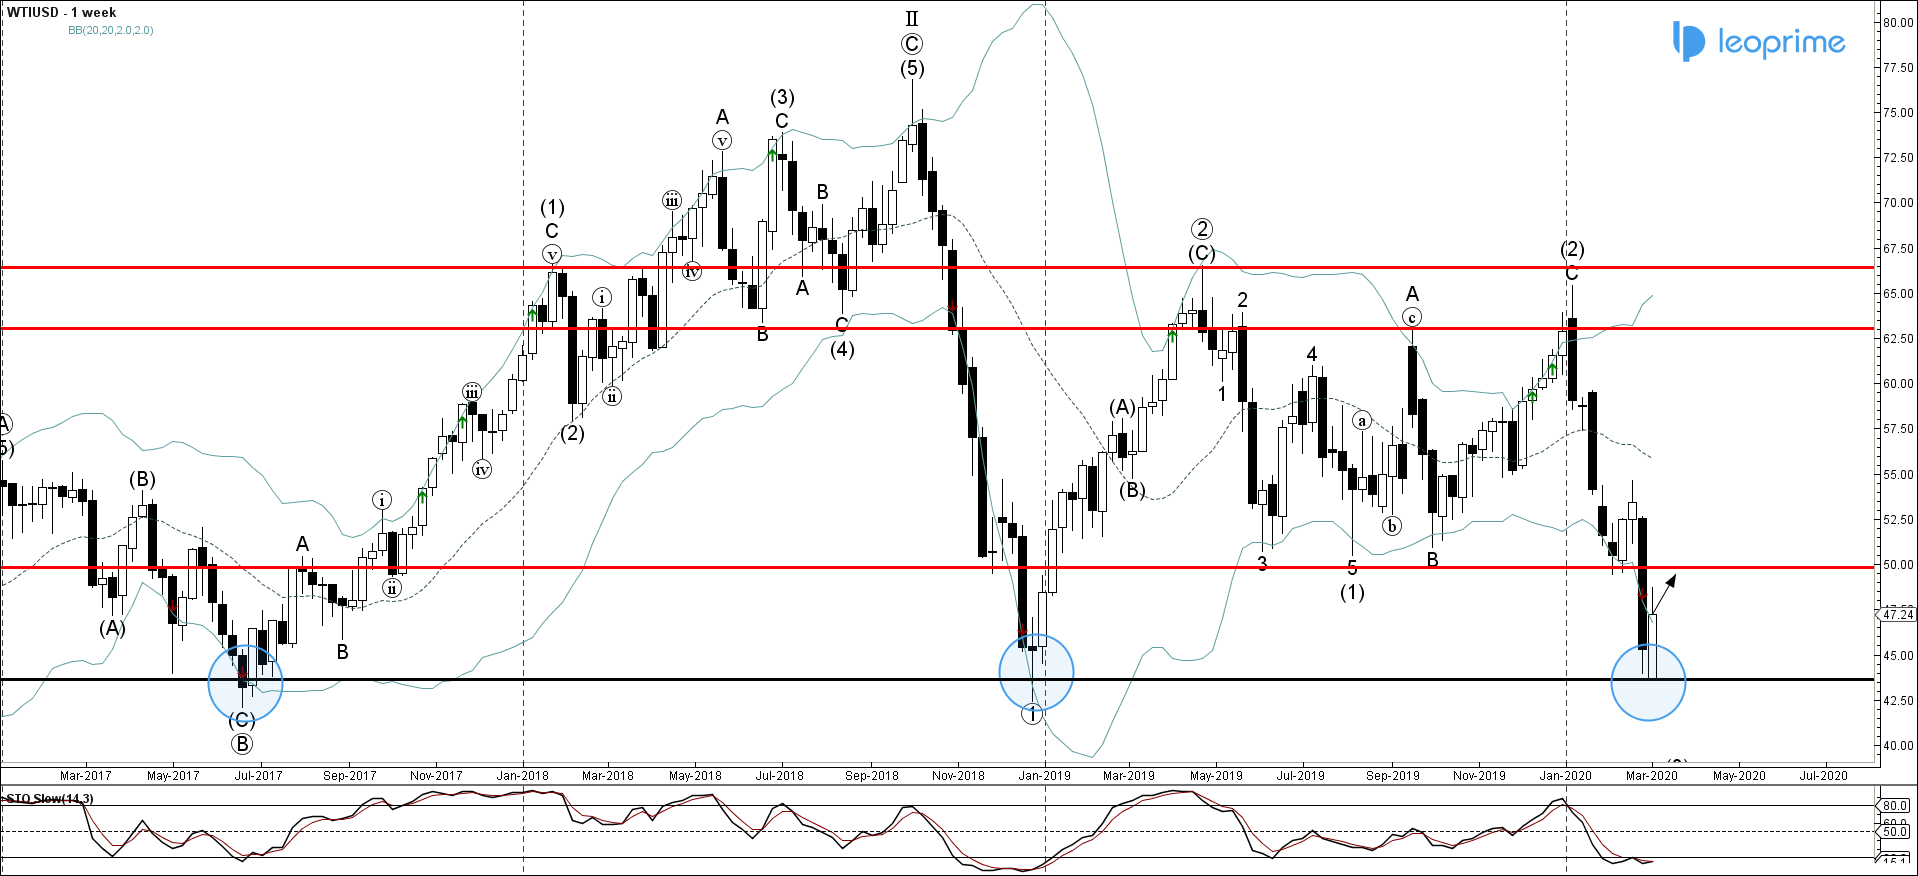
WTI recently reversed up sharply from the support area lying between the long-term support level 43.600 (which previously stopped the downtrends in 2017 and 2018, as can be seen from the weekly WTI chart below) and the lower weekly Bollinger Band. The upward reversal from this support area stopped the pervious impulse wave (3). Given the oversold reading on the weekly Stochastic indicator – WTI is likely to rise further toward the next round resistance level 50.000. In the alternative scenario – WTI will retest the powerful support level 43.600 – the breakout of which can lead to further losses toward 40.000.
WTI reversed from 43.600 long-term support area; Likely to rise to 50.000


