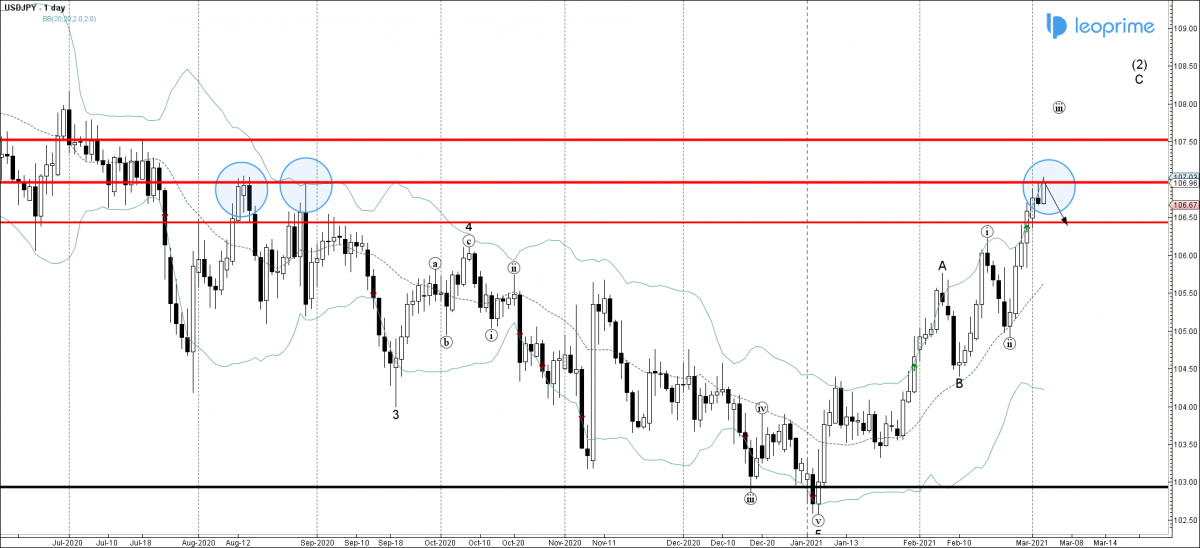
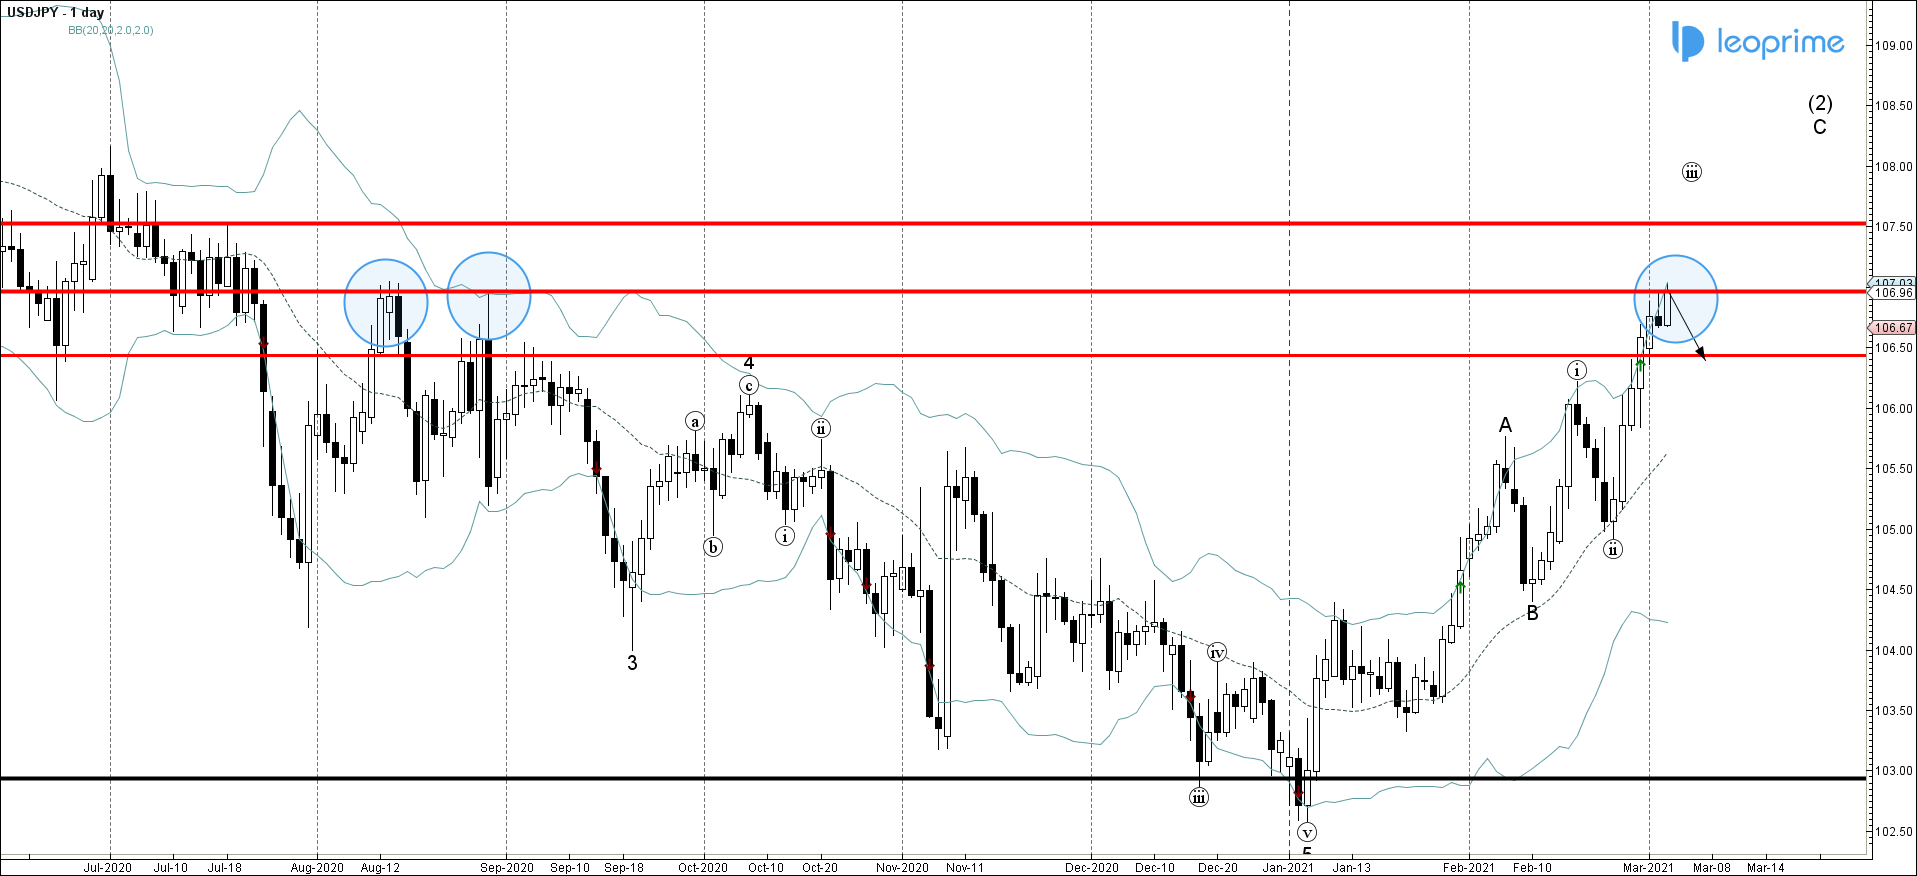
USDJPY currency pair has been rising sharply in the last few trading session and today approached the resistance area lying between the long-term resistance level 107.000 (former Double Top from August of 2020 as can be seen from the daily USDJPY chart below) and the upper daily Bollinger Band. Given the strength of the resistance level 107.000 – USDJPY currency pair might correct down to the next support level 106.50. If the pair manages to break above the resistance level 107.000 – USDJPY can then rise to the next resistance level 107.500
USDJPY approached long-term resistance level 107.000; Likely to correct down to 106.500


