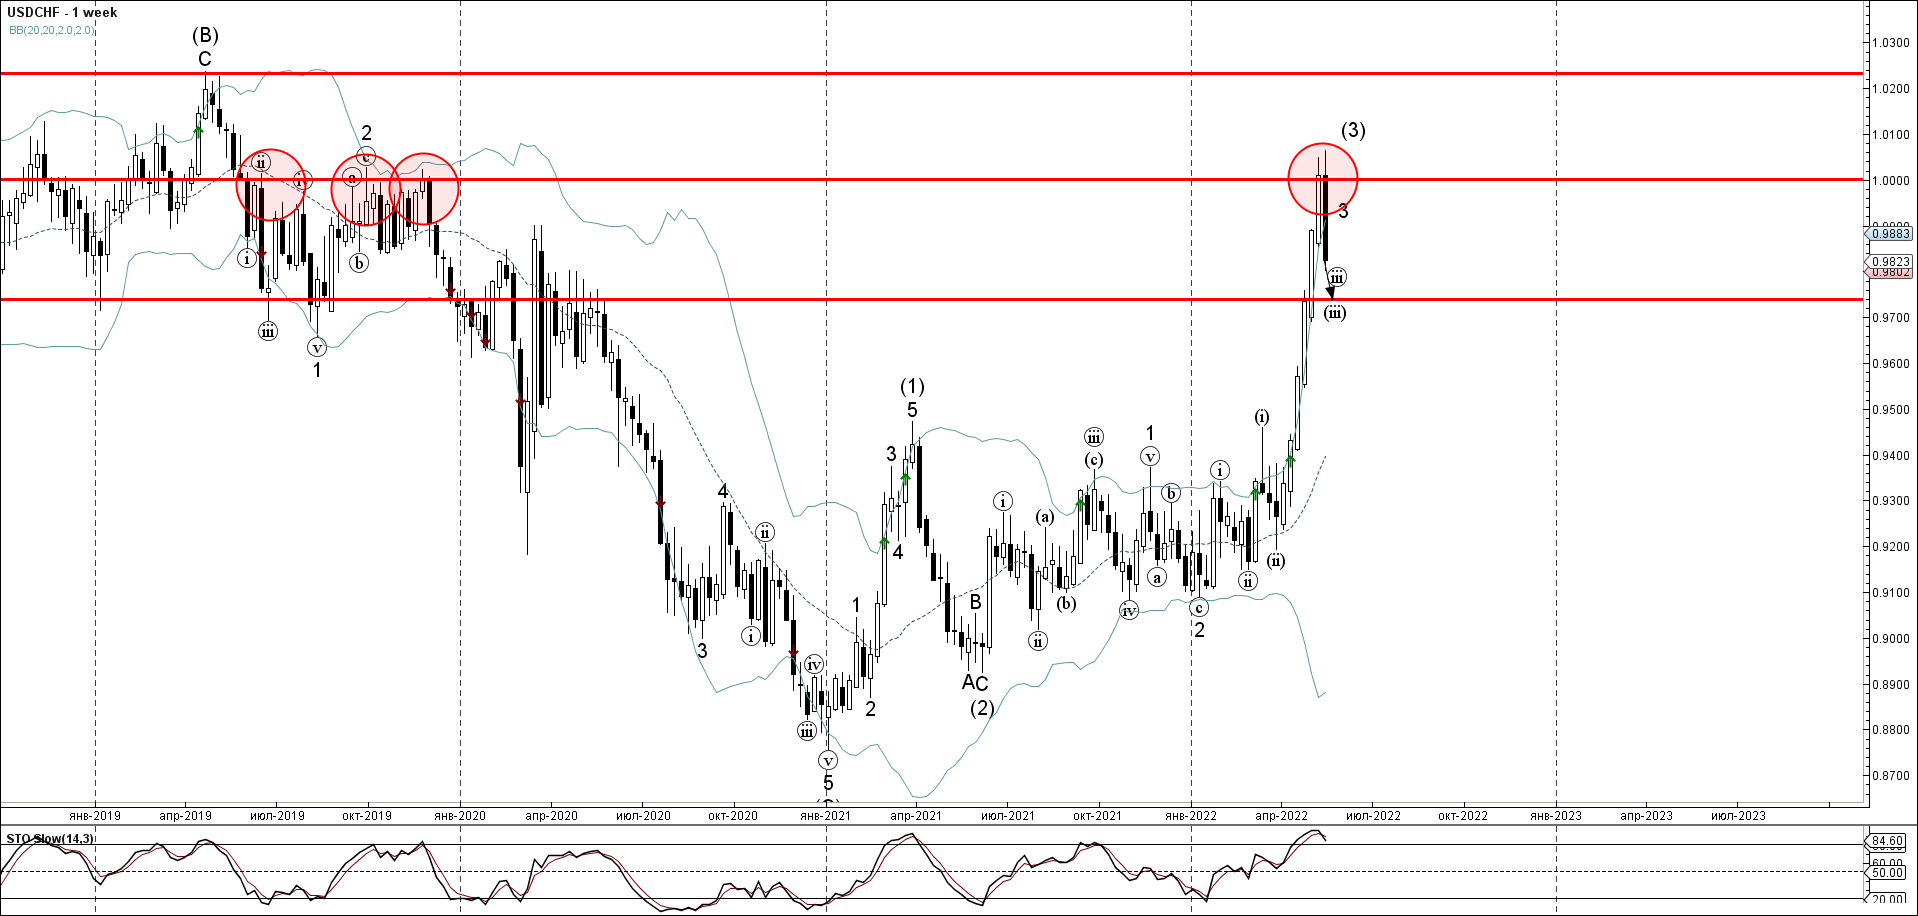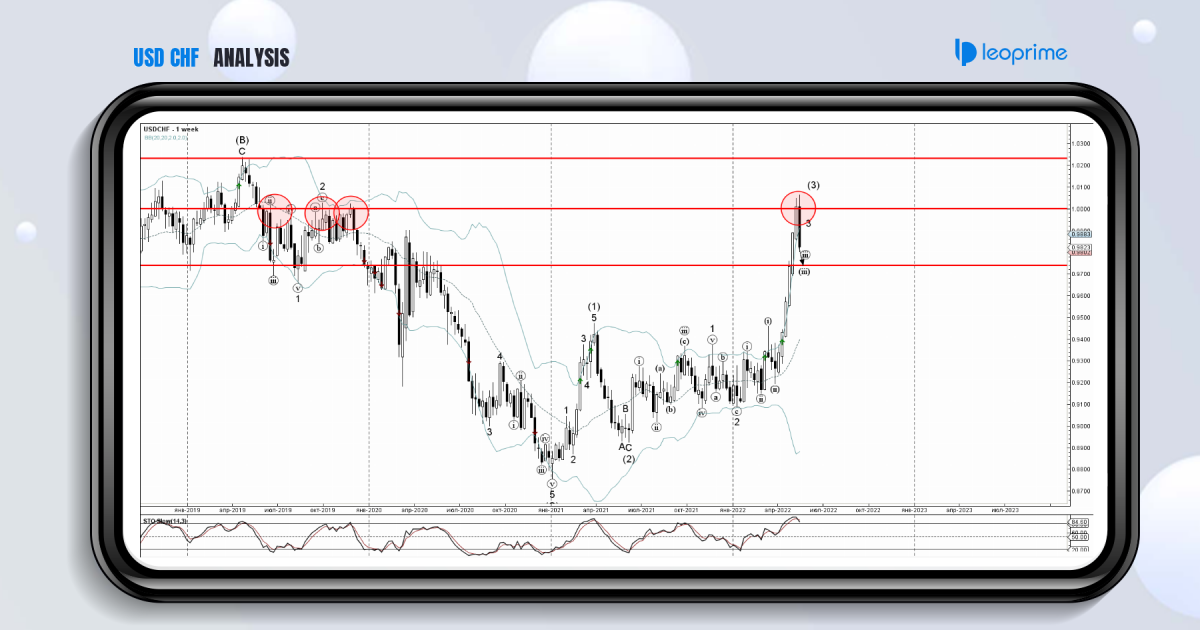
USDCHF currency pair recently reversed down from the resistance area located between the key resistance level standing at parity (which has been stopping all of the upward impulse waves from the middle of 2019, as can be seen from the weekly USDCHF chart below) and the upper weekly Bollinger Band. Given the strength of the aforementioned resistance area and the still overbought trading on the weekly Stochastic indicator – USDCHF currency pair can be expected to fall further toward the next support level 0.97400 (target for the completion of the active wave (iii)).
USDCHF reversed from resistance zone; Likely to fall to support level 0.97400.


