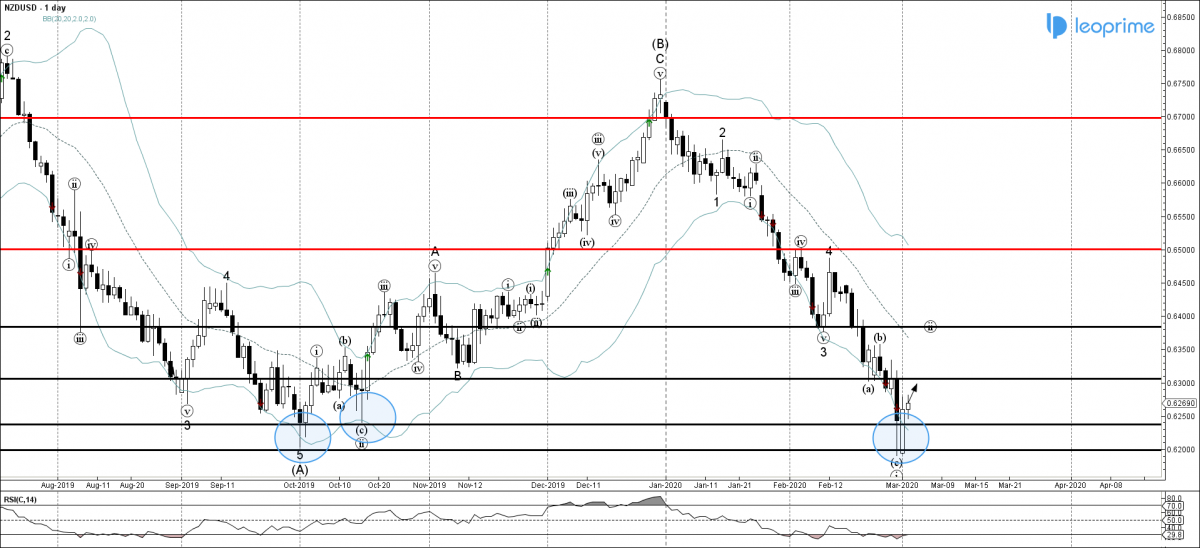
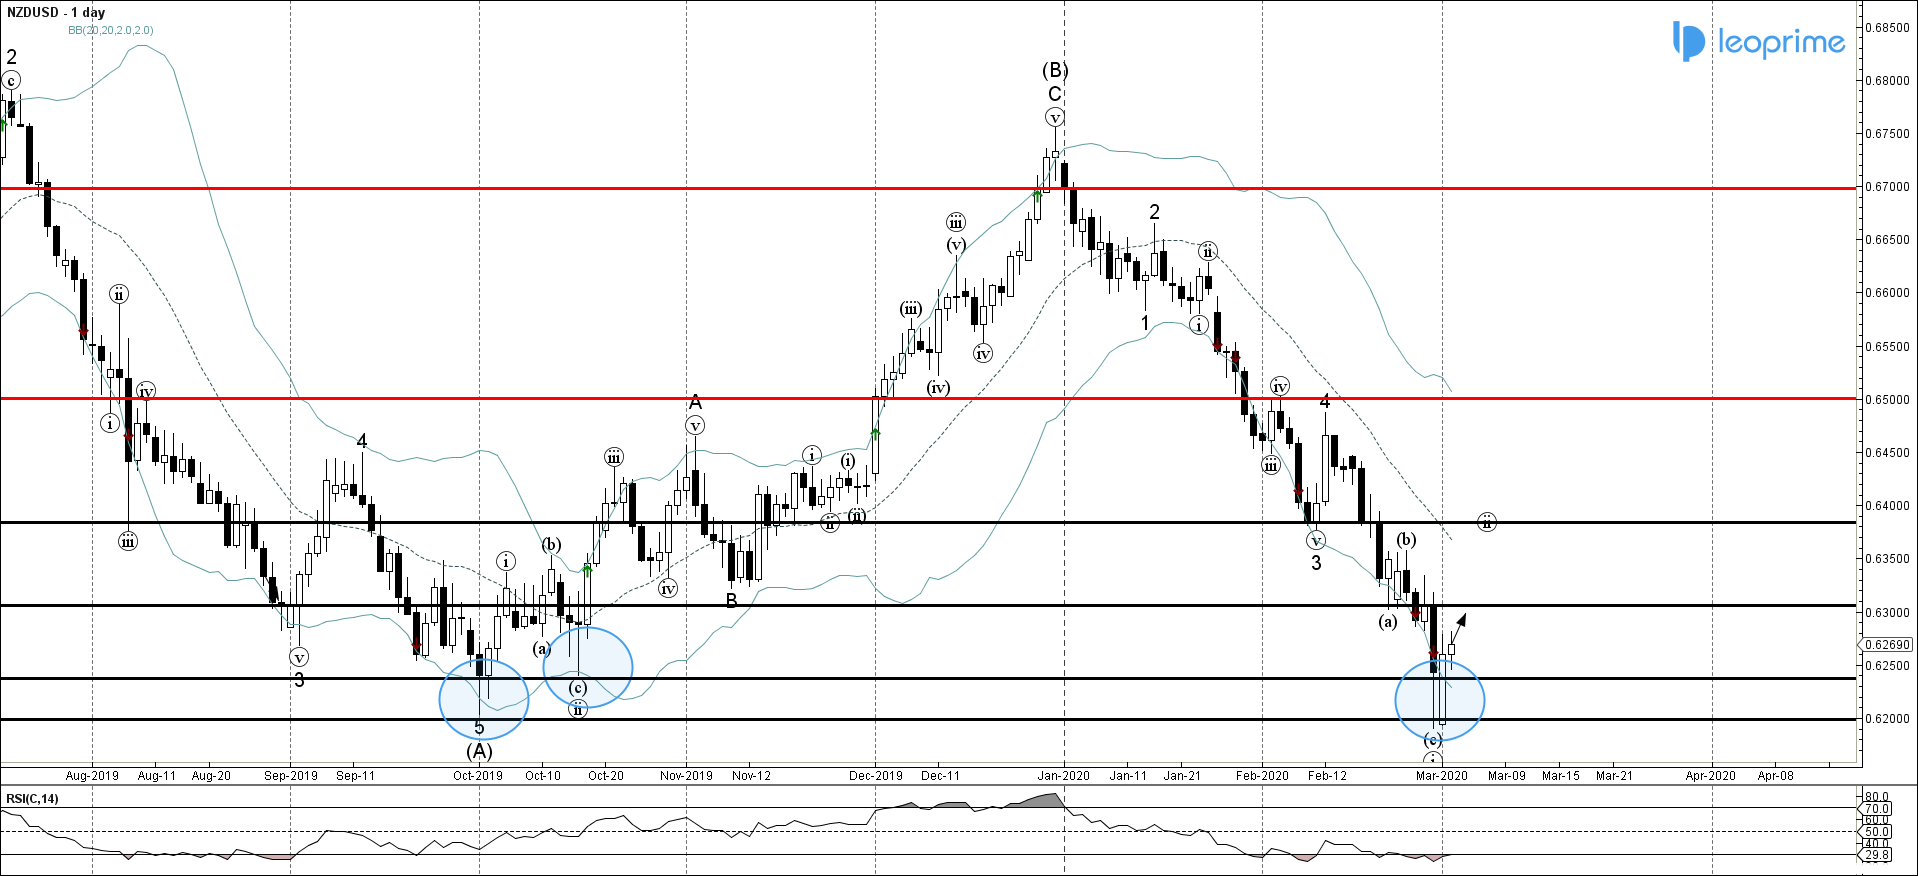
NZDUSD recently reversed up sharply from the support zone lying between the lower daily Bollinger Band, key support level 0.62000 (which stopped the previous sharp downtrend in October) and the support level 0.62500 (low of the previous correction (ii). The upward reversal form this support area started the active correction (ii). The upward reversal form the aforementioned support area created the daily candlesticks reversal pattern Piercing Line. Given the oversold reading on the daily RSI indicator – NZDUSD is likely to rise further toward the next resistance level 0.63000 (low of the earlier correction (a) from February).
NZDUSD reversed from 0.62000 support zone; Likely to rise to 0.63000


