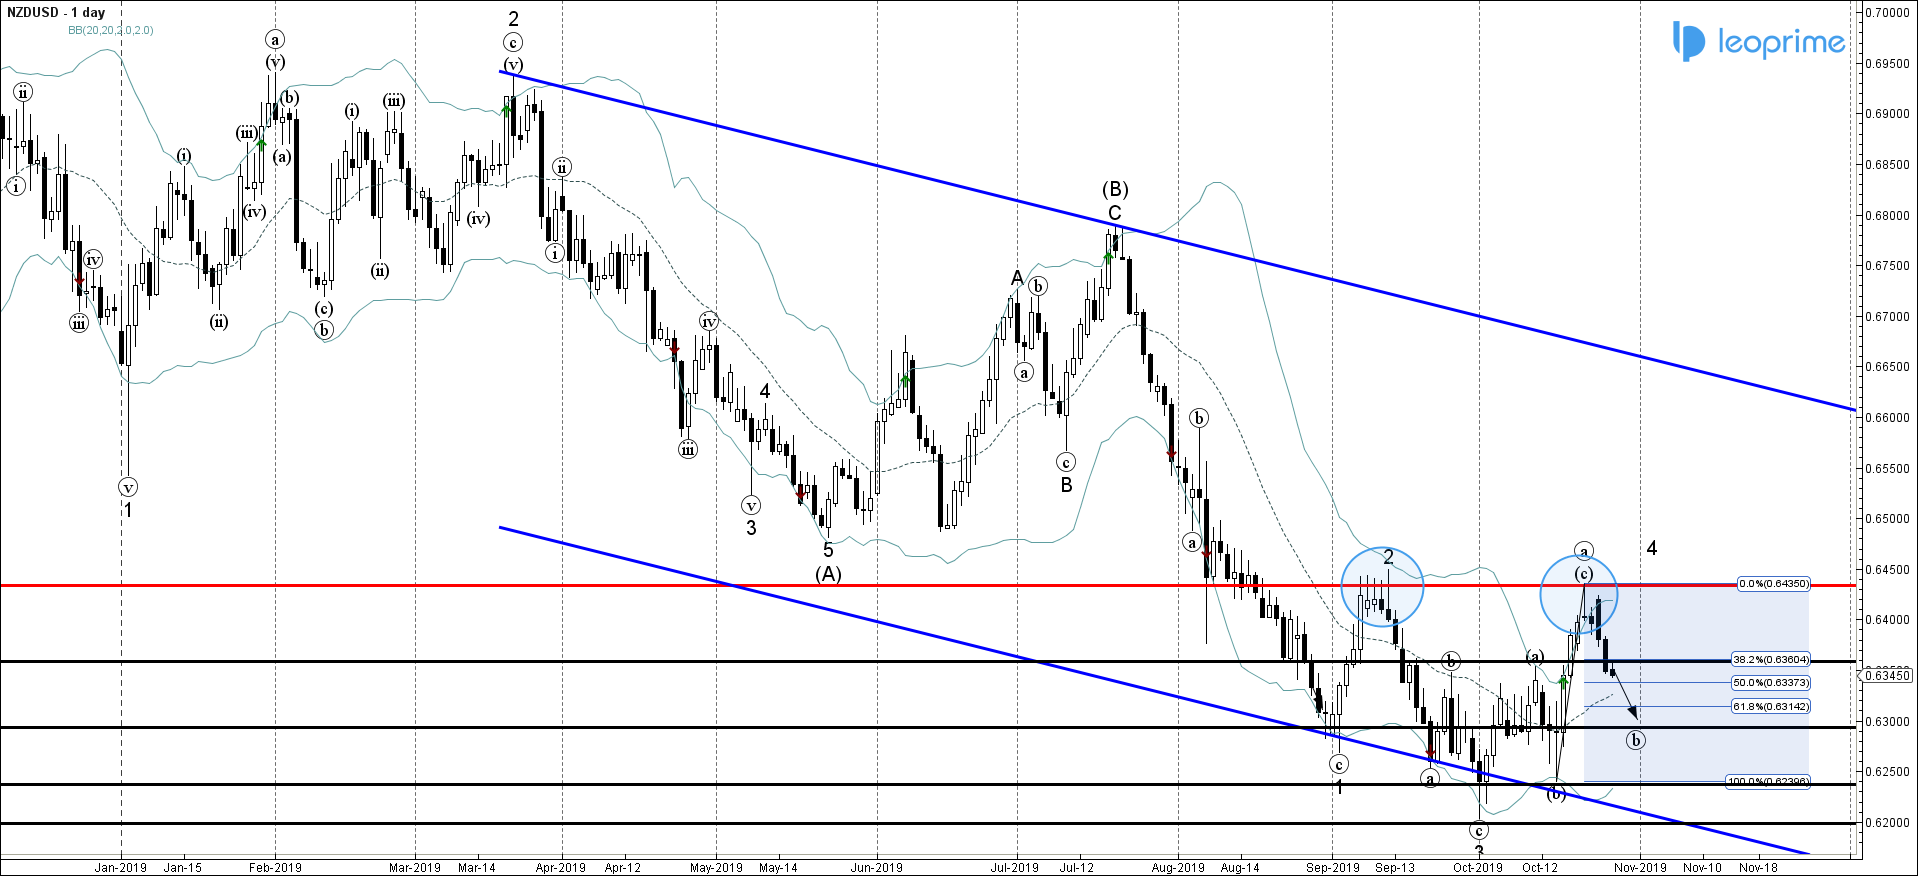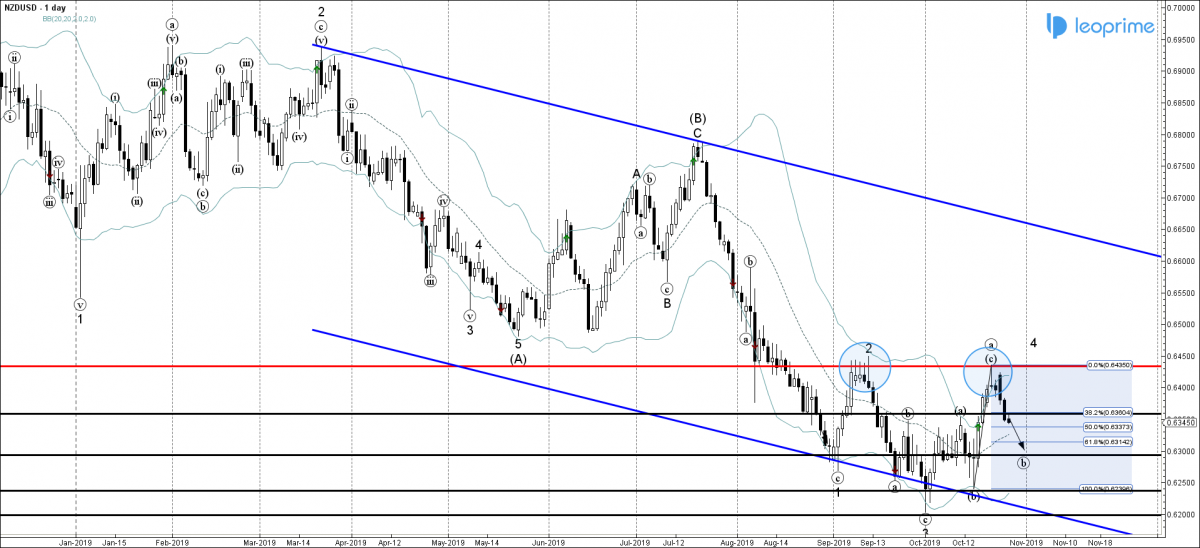
NZDUSD recently broke below the key support level 0.6360 (previous sell target which is also the former resistance from September and the start of October) intersecting with the 50% Fibonacci correction of the previous upward impulse wave from the start of August. Given the clear downtrend visible on the daily charts – NZDUSD is likely to fall further in the active corrective wave (b) toward the next support level 0.6300 (target price calculated for the completion of the wave (b))


