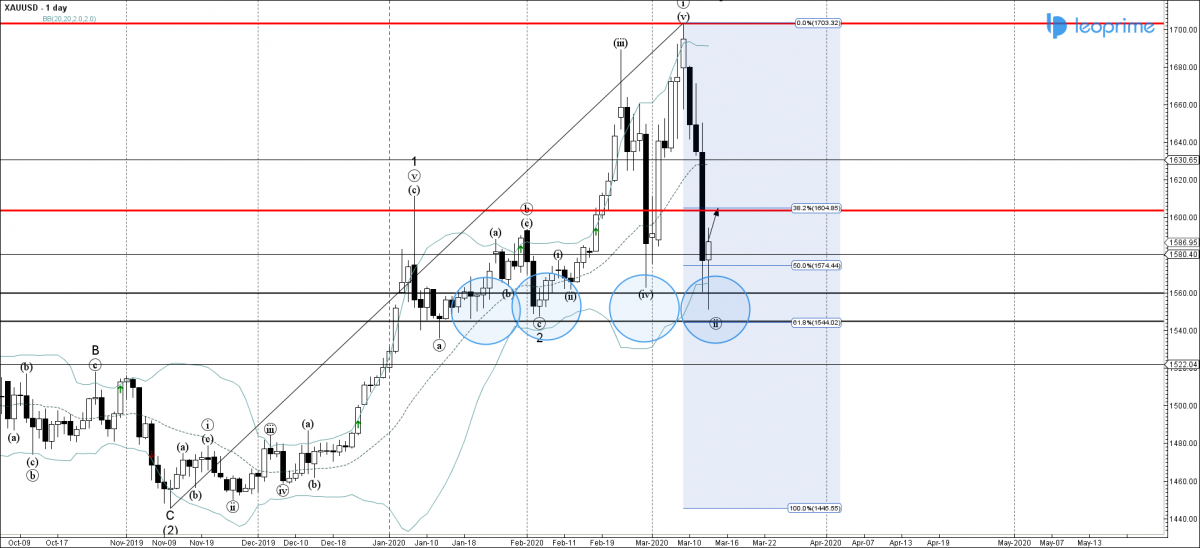
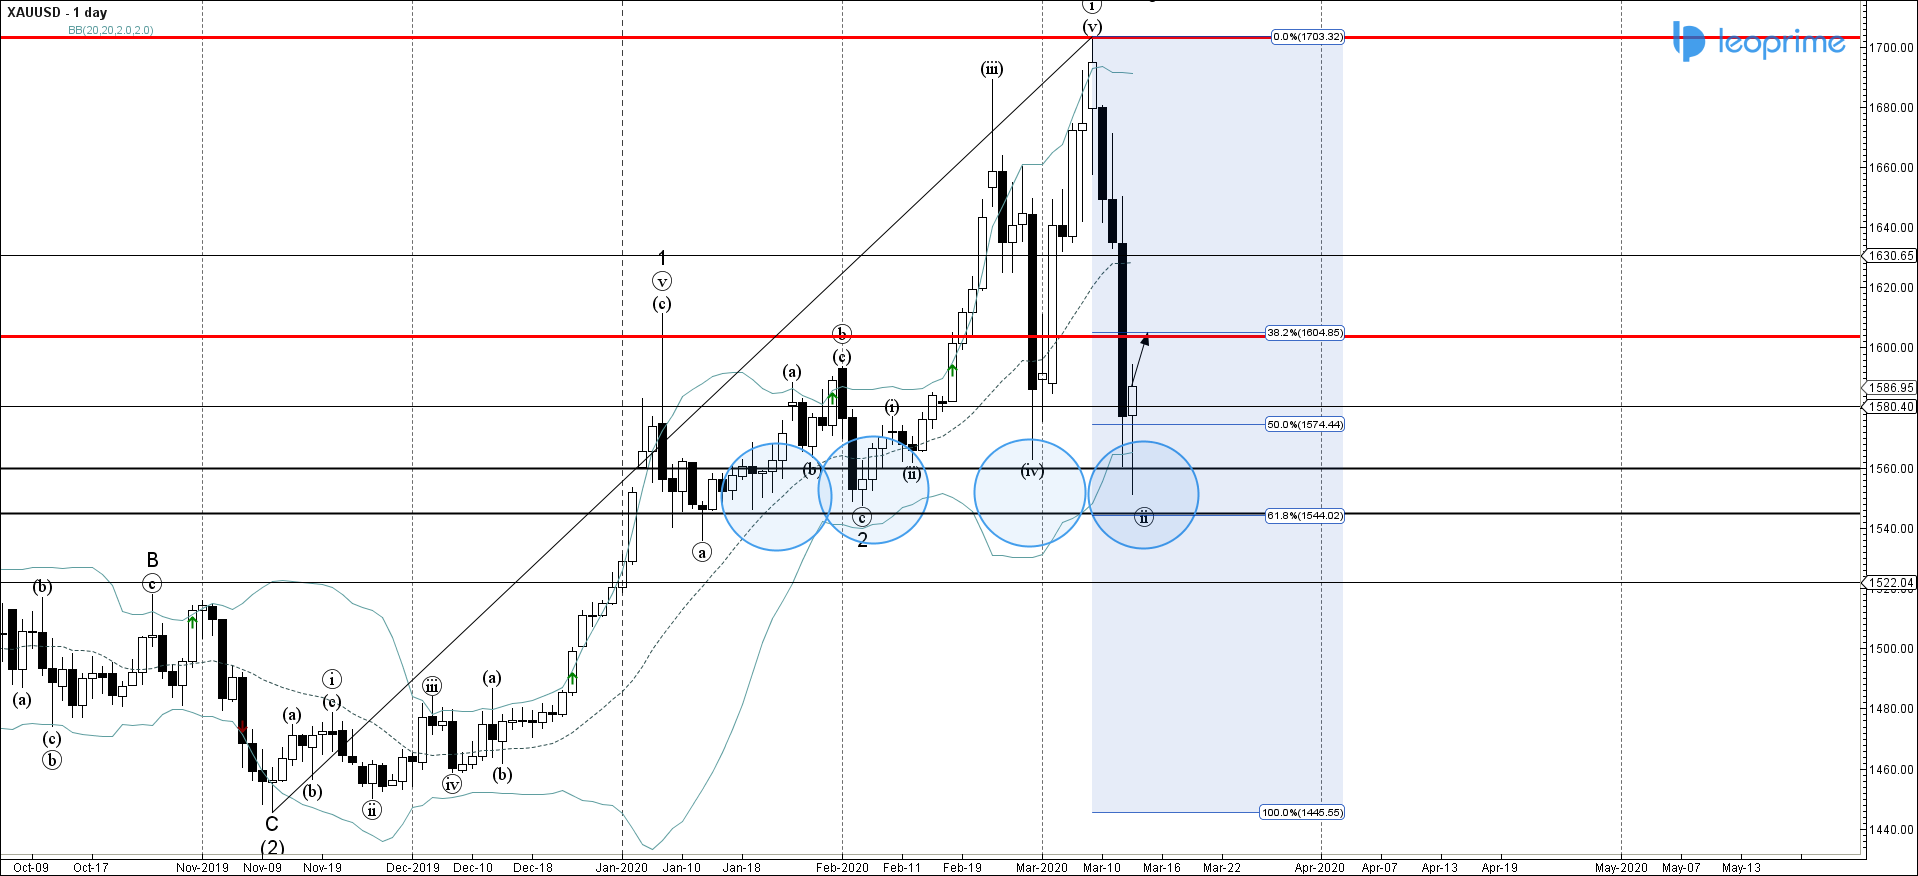
Gold recently reversed up from the support area lying between the key support levels 1560.00, 1540.00, lower daily Bollinger Band and the 50% Fibonacci correction of the previous sharp impulse wave from the middle of November. The upward reversal from this support area stopped the earlier short-term correction (ii). Given the long-term uptrend visible on the daily Gold charts – Gold is likely to rise further toward the next round resistance level 1600.00 (former strong resistance from January).


