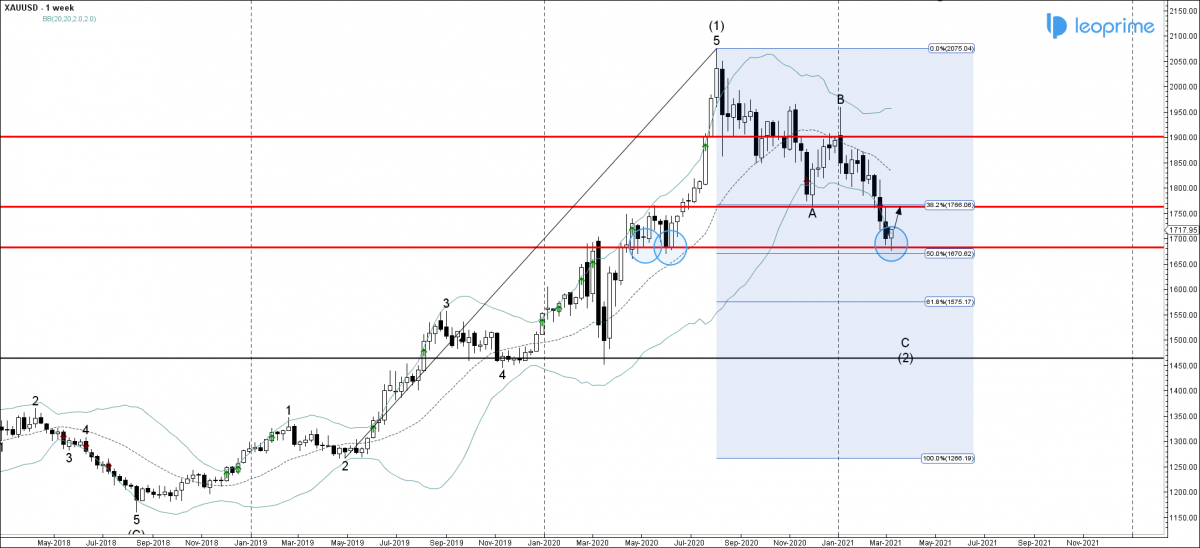
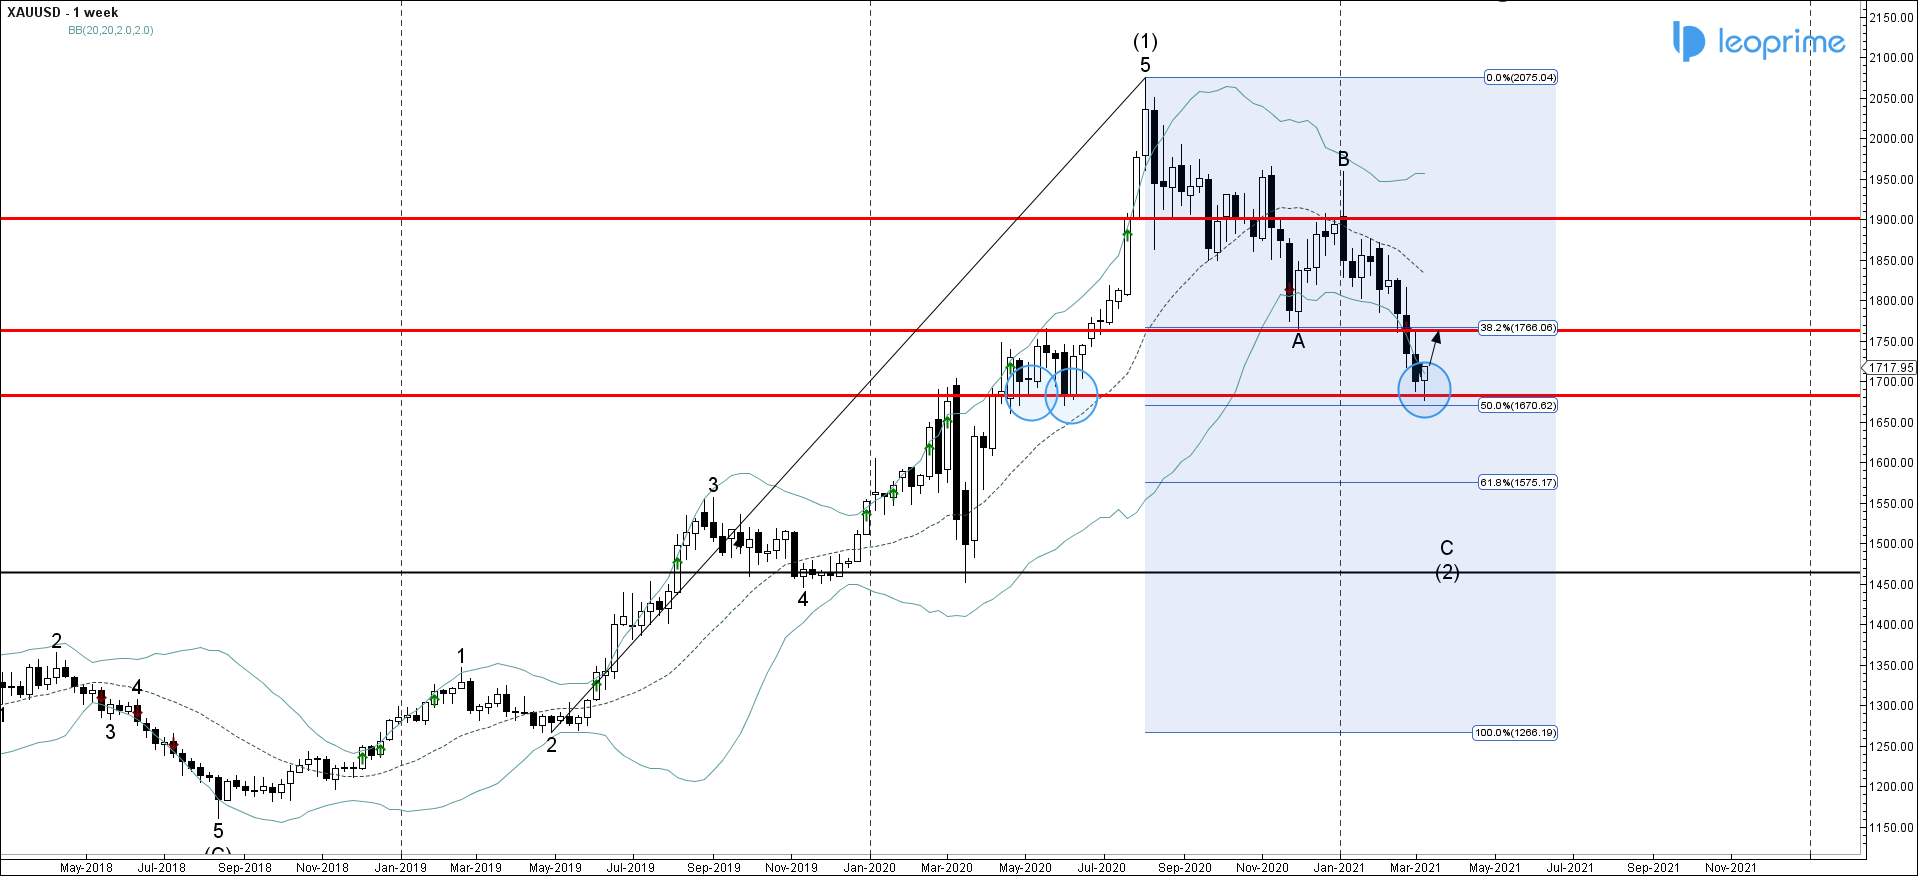
Gold recently reversed up sharply from the major long-term support level 1682.00 (former strong resistance from March of 2020, which has been reversing the pair from the start of last year, as can be seen from the weekly Gold chart below). The support area near the support level 1682.00 is strengthened by the lower weekly Bollinger Band and by the 50% Fibonacci correction of the upward impulse form the start of 2019. Given the falling interest rates in USA – Gold can be expected to rise further toward the next resistance level 1762.00 (former major resistance from the end of 2020).
Gold reversed from long-term support level 1682.00; Likely to reach resistance level 1762.00


