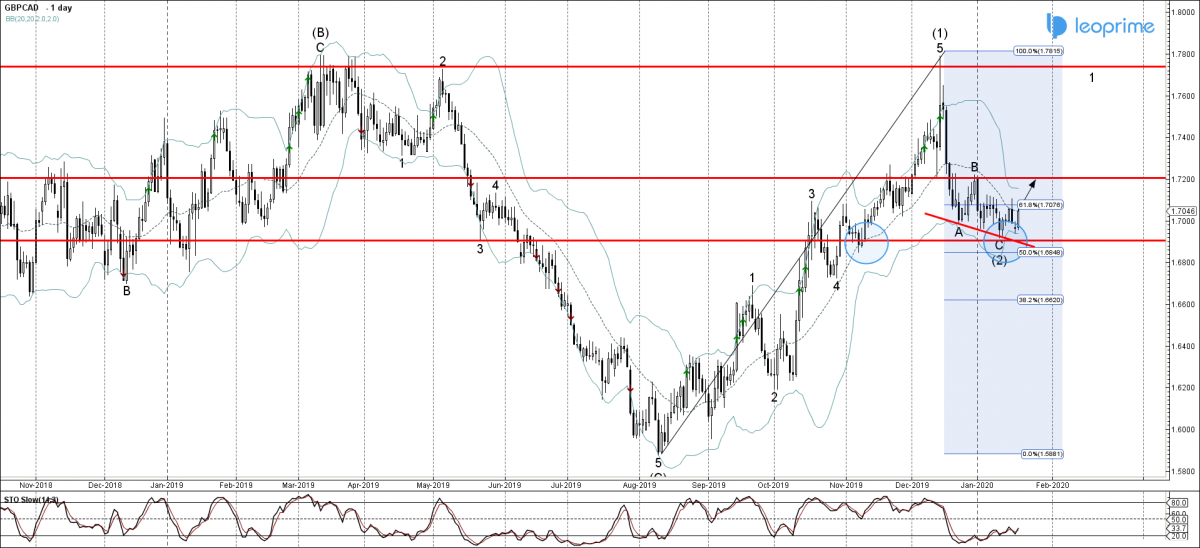
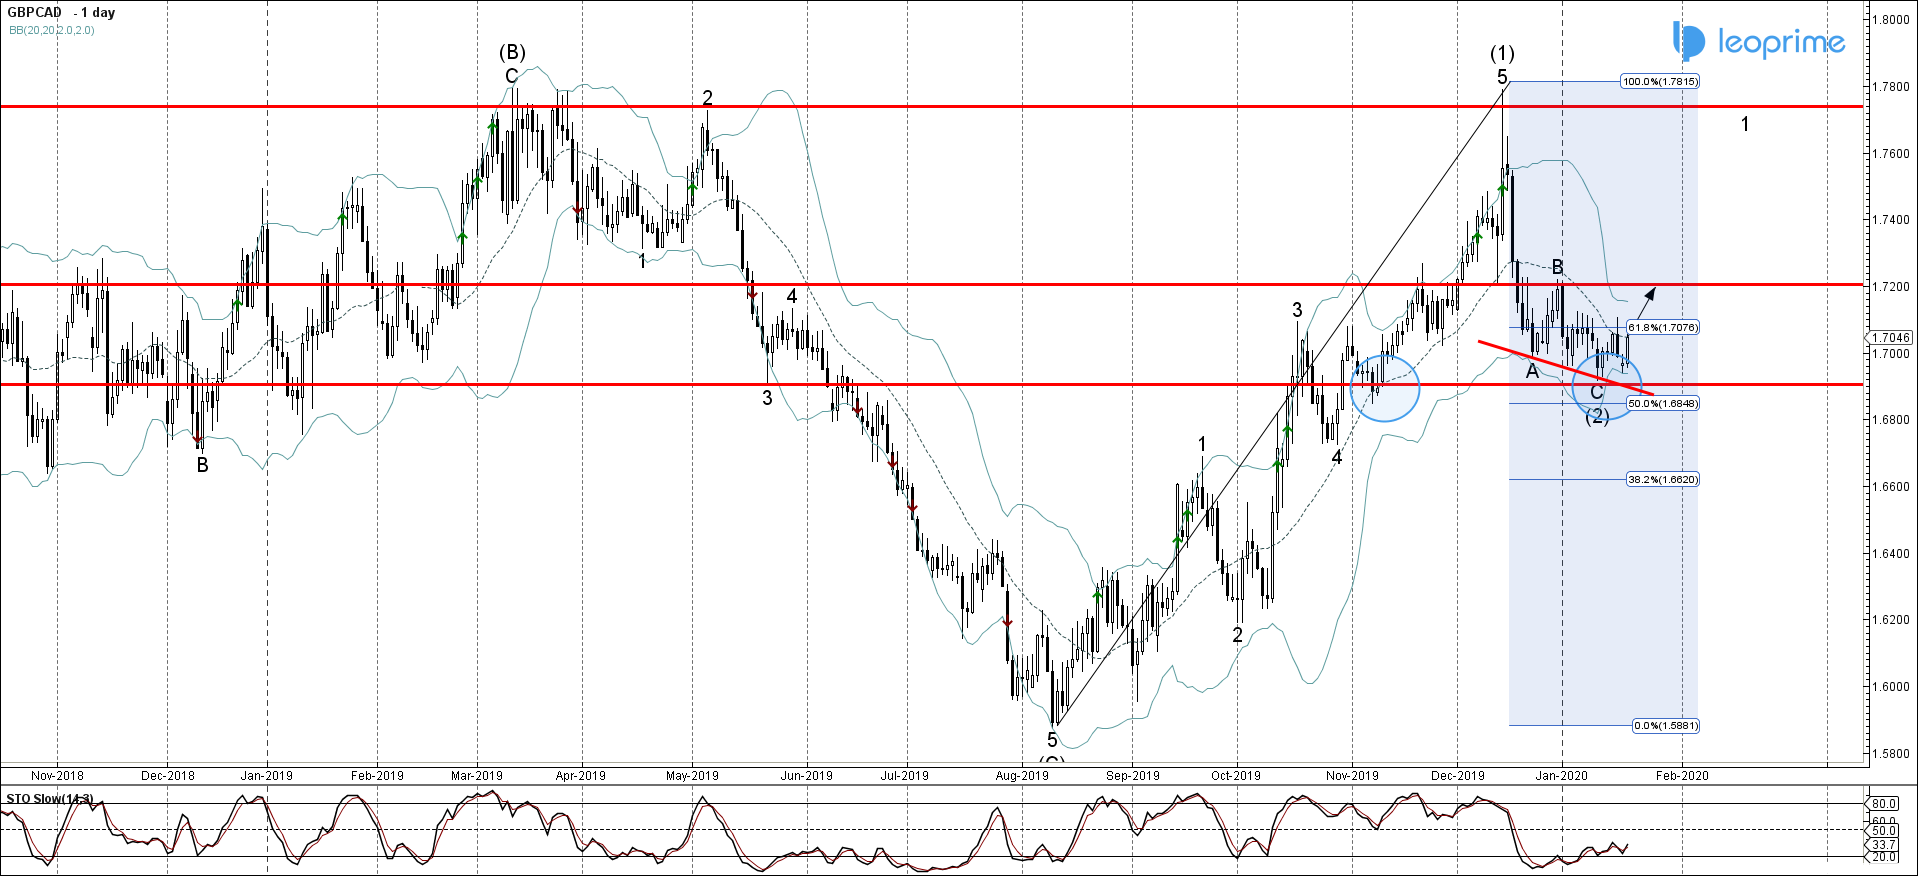
GBPCAD recently reversed up with the daily candlesticks reversal pattern Bullish Engulfing from the support area located between the support level 1.69000 (monthly low from November), lower daily Bollinger Band and the 50% Fibonacci correction of the previous sharp upward impulse wave (1) from November. Given the clear daily uptrend and the bullish divergence visible on the daily Stochastic indicator – GBPCAD is likely to rise further toward the next resistance level 1.72000 (top of the previous wave B from the end of December).
GBPCAD reversed from 1.69000 support area; Likely to rise to 1.72000


