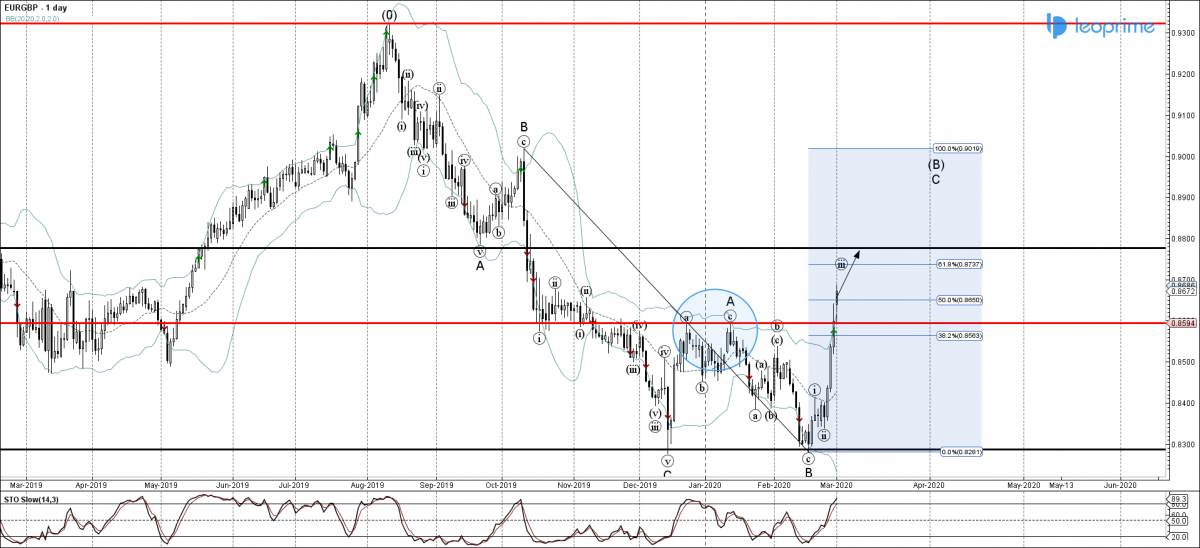
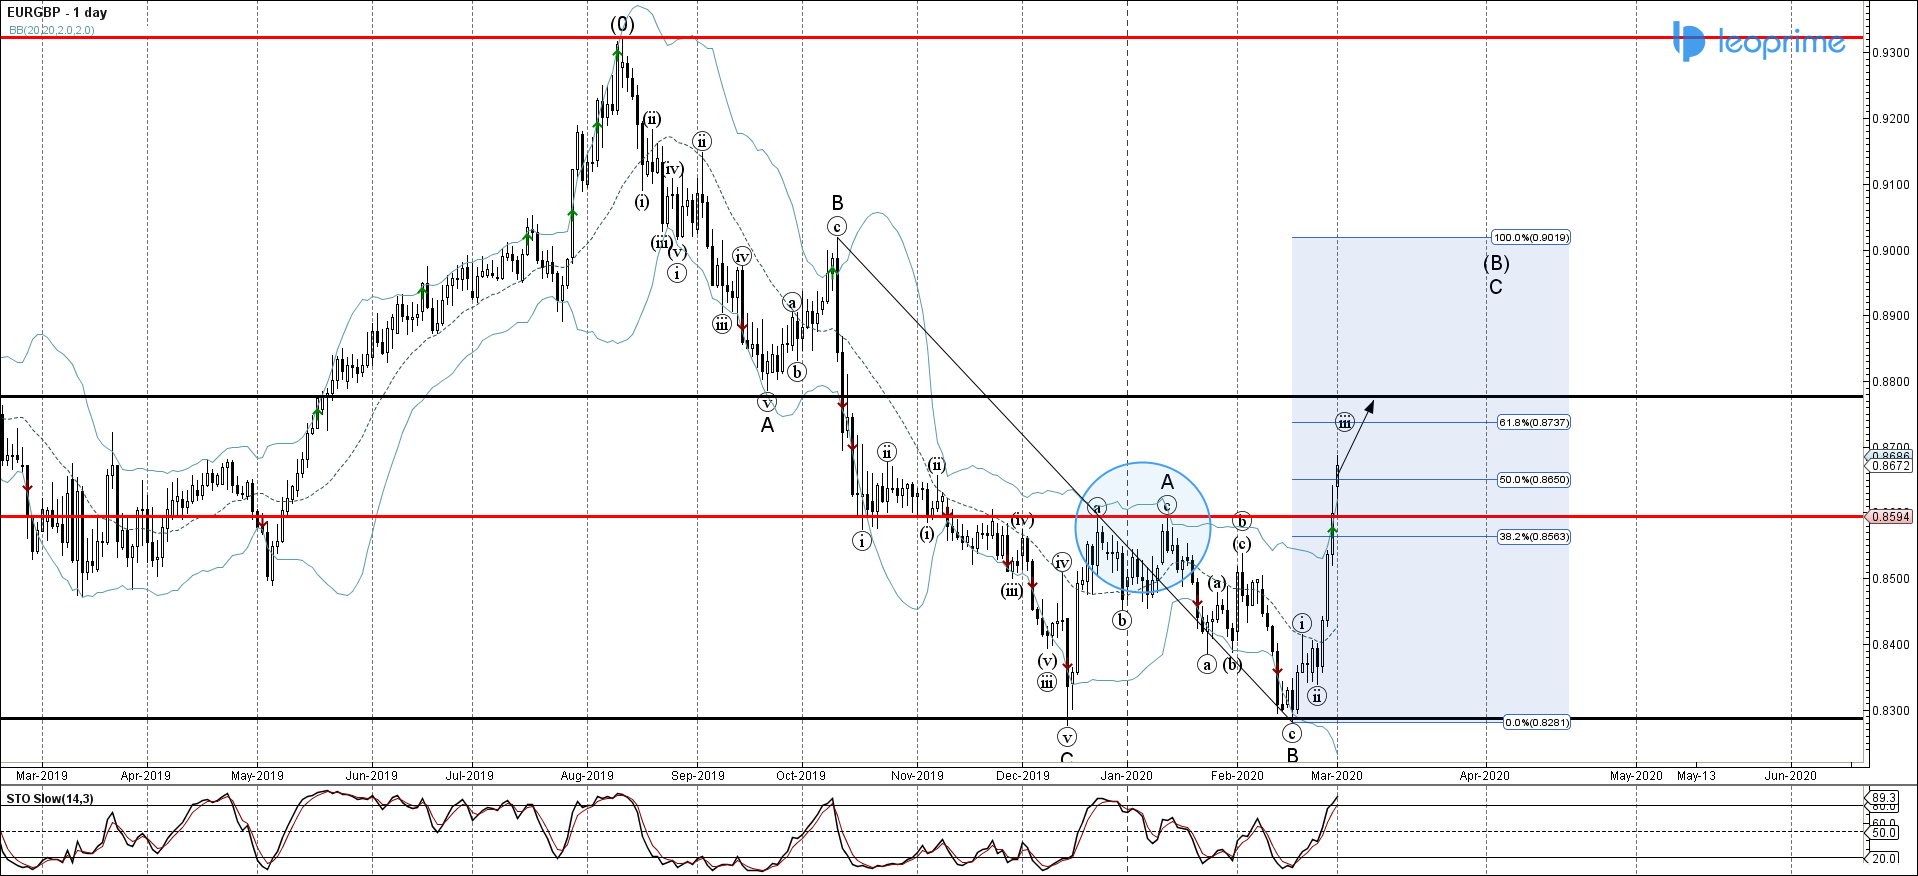
EURGBP recently broke sharply through the resistance zone lying between the resistance level 0.85950 (which has been reversing the price from November, as can be seen from the daily EURGBP chart below) and the 38.2% Fibonacci correction of the earlier downward impulse from October. The aforementioned price area is acting as the strong support zone after it was broken. The proximity of this support area and the strong bearish Sterling sentiment add to the likelihood of further gains toward the next resistance level 0.87750 (former support from September).
EURGBP broke 0.85950 resistance zone; Likely to rise to 0.87750


