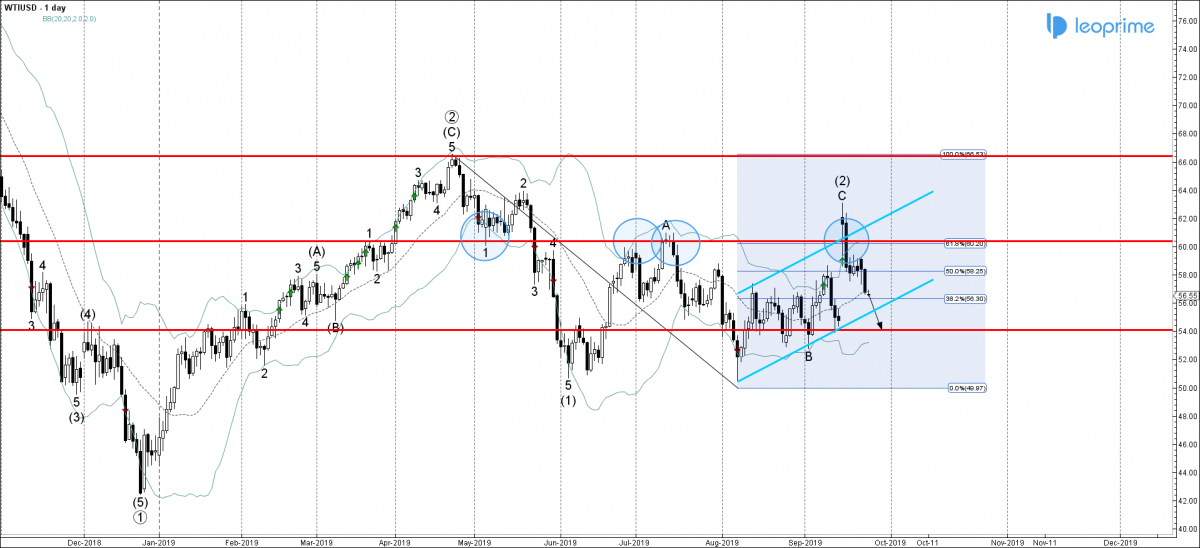
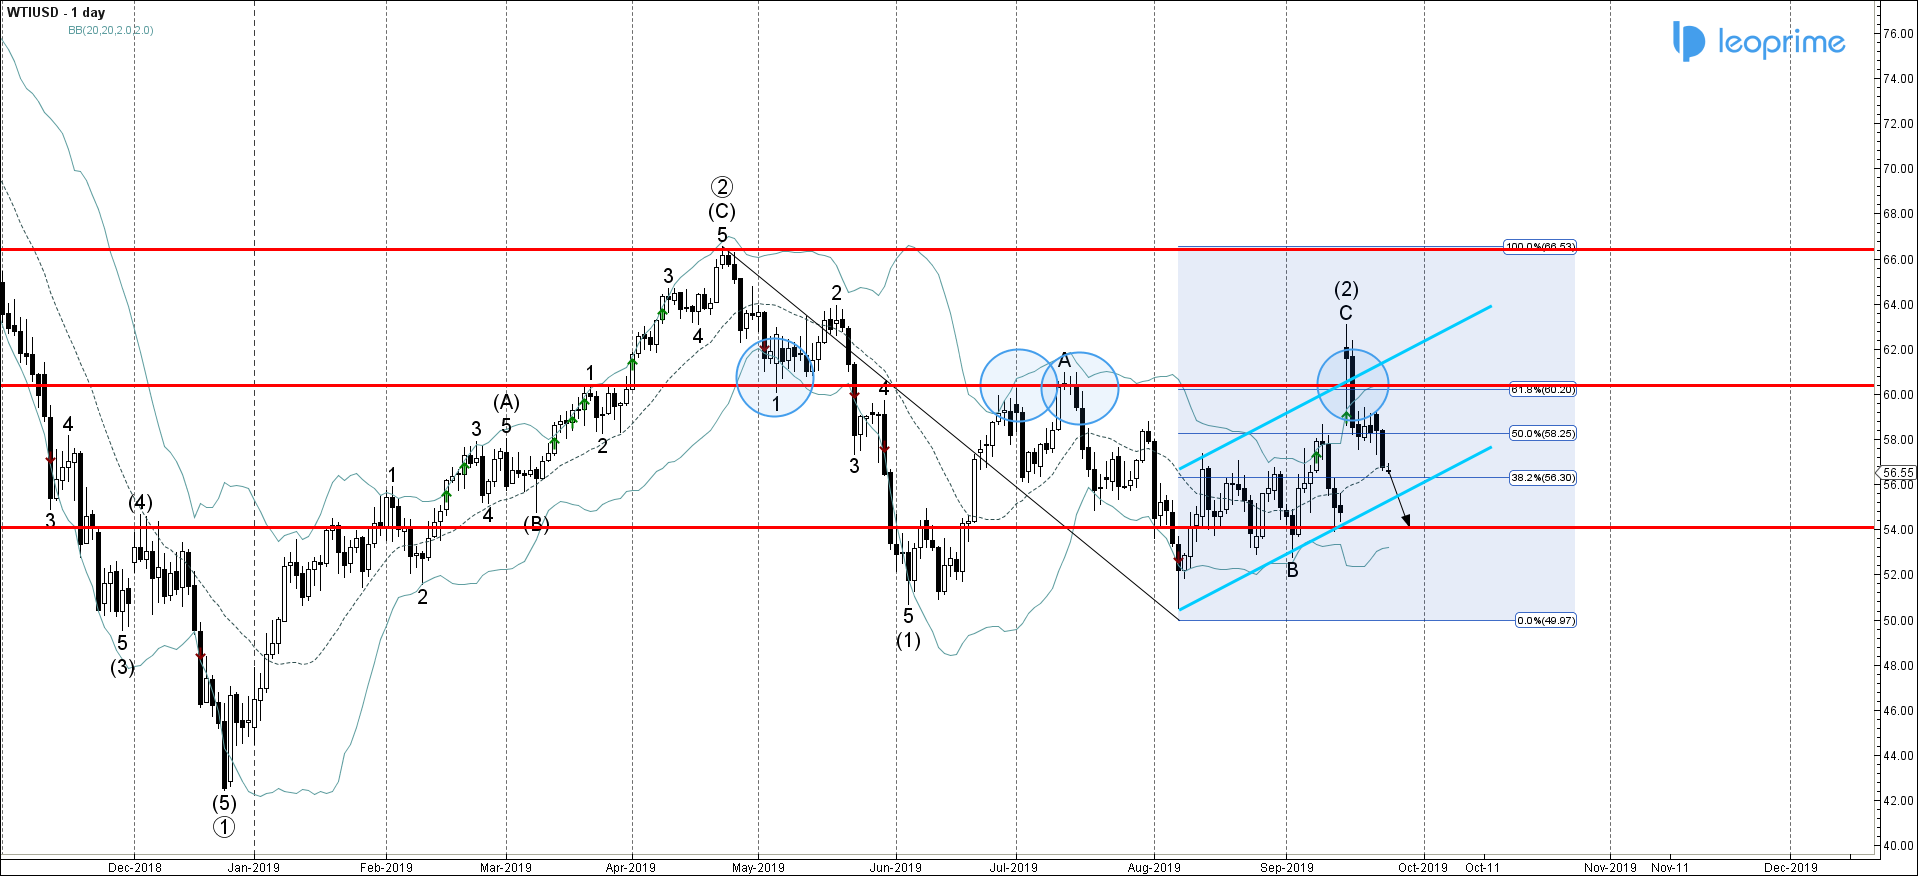
WTI continue to fall inside the medium-term impulse wave (3) which started earlier from the resistance area located between the key resistance level 60.00 (former monthly high from July), upper daily Bollinger Band, resistance trendline of the daily up channel from August and the 61.8% Fibonacci correction of the previous downward impulse from April. Given the strength of the aforementioned resistance area, WTI is likely to remain under bearish pressure today and extend the losses toward the next support level 54.00. The price will need to break the support trendline of the aforementioned up channel – to reach this sell target.
WTIUSD falls inside impulsive wave ; likely to fall 54.00


