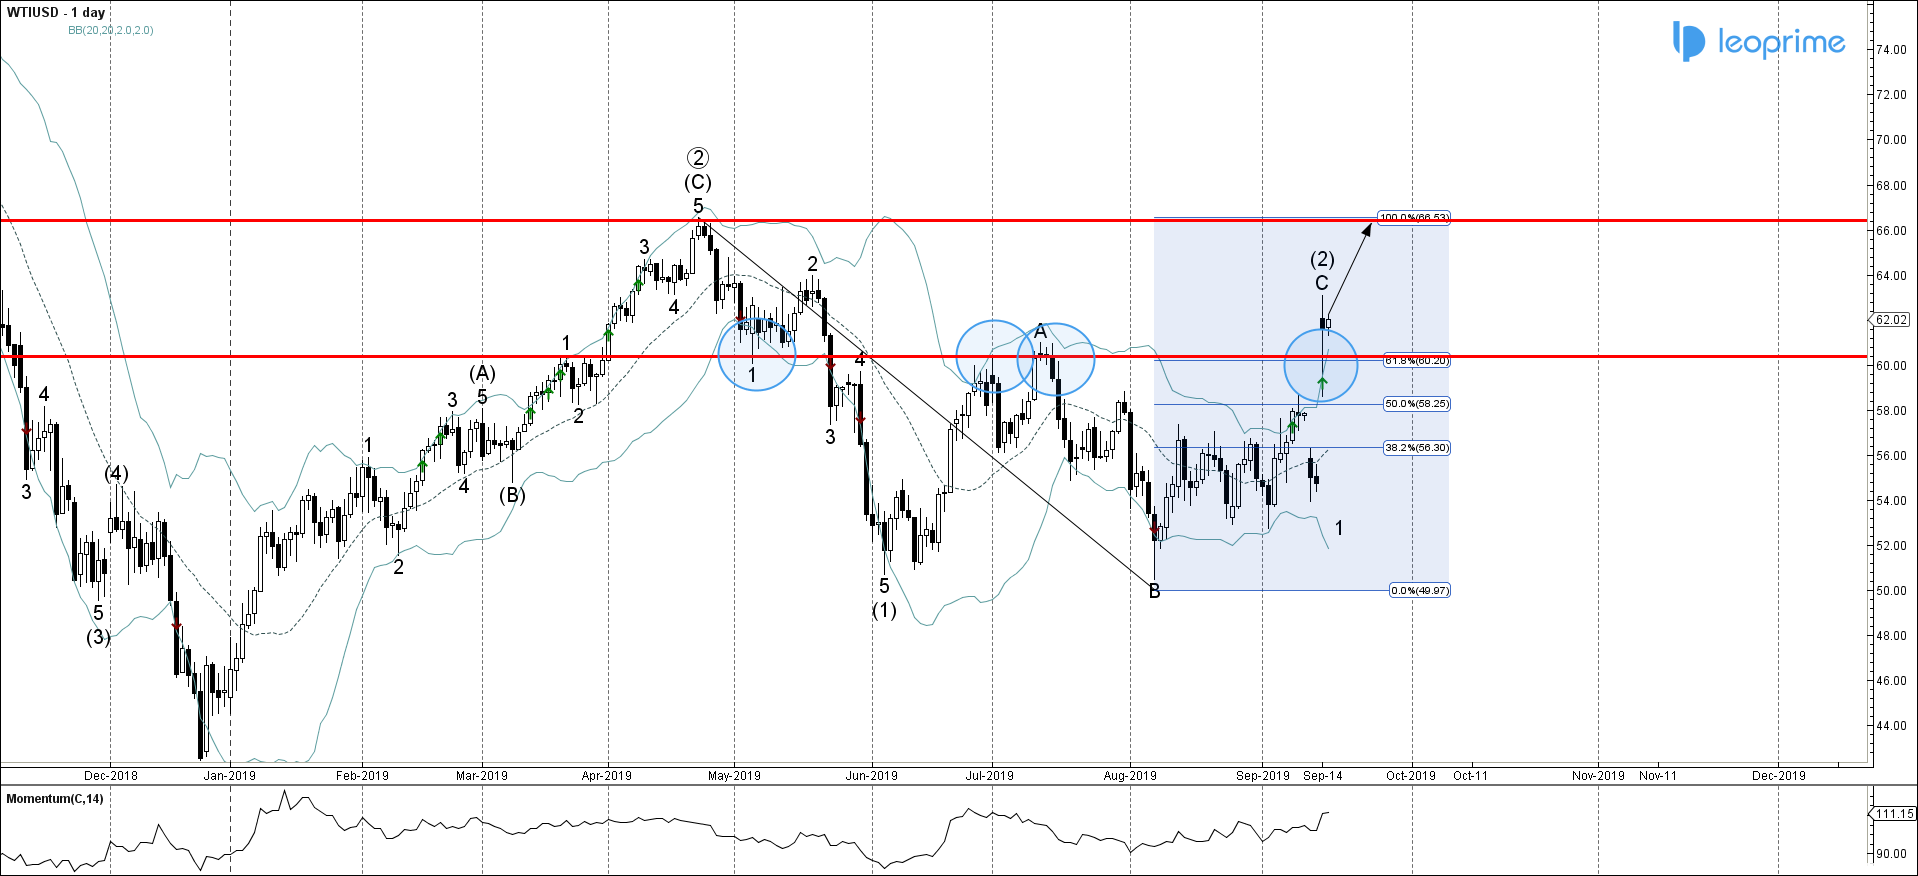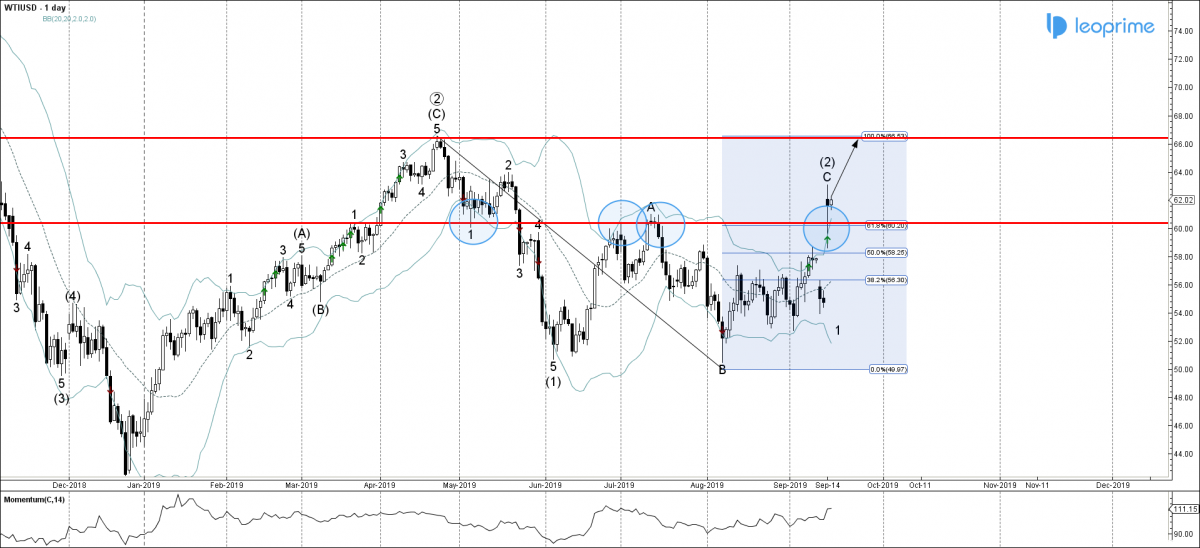
WTI previously broke through the key resistance area lying between the strong resistance level 60.40 (monthly high from June and July) and the 61.8% Fibonacci correction of the previous downward impulse from the end of April. The breakout of this resistance area continues the active impulse wave C of the medium-term ABC correction (2) from June. The aforementioned price area is providing strong support to WTI after it was broken. With the rising daily Momentum, WTI is likely to remain under bullish pressure in the coming trading sessions and retest the next major multi-month resistance level 66.40 (which stopped the earlier long-term ABC correction ② in April).


