• EURNZD reversed from resistance area
• Further losses likely toward 1.7340
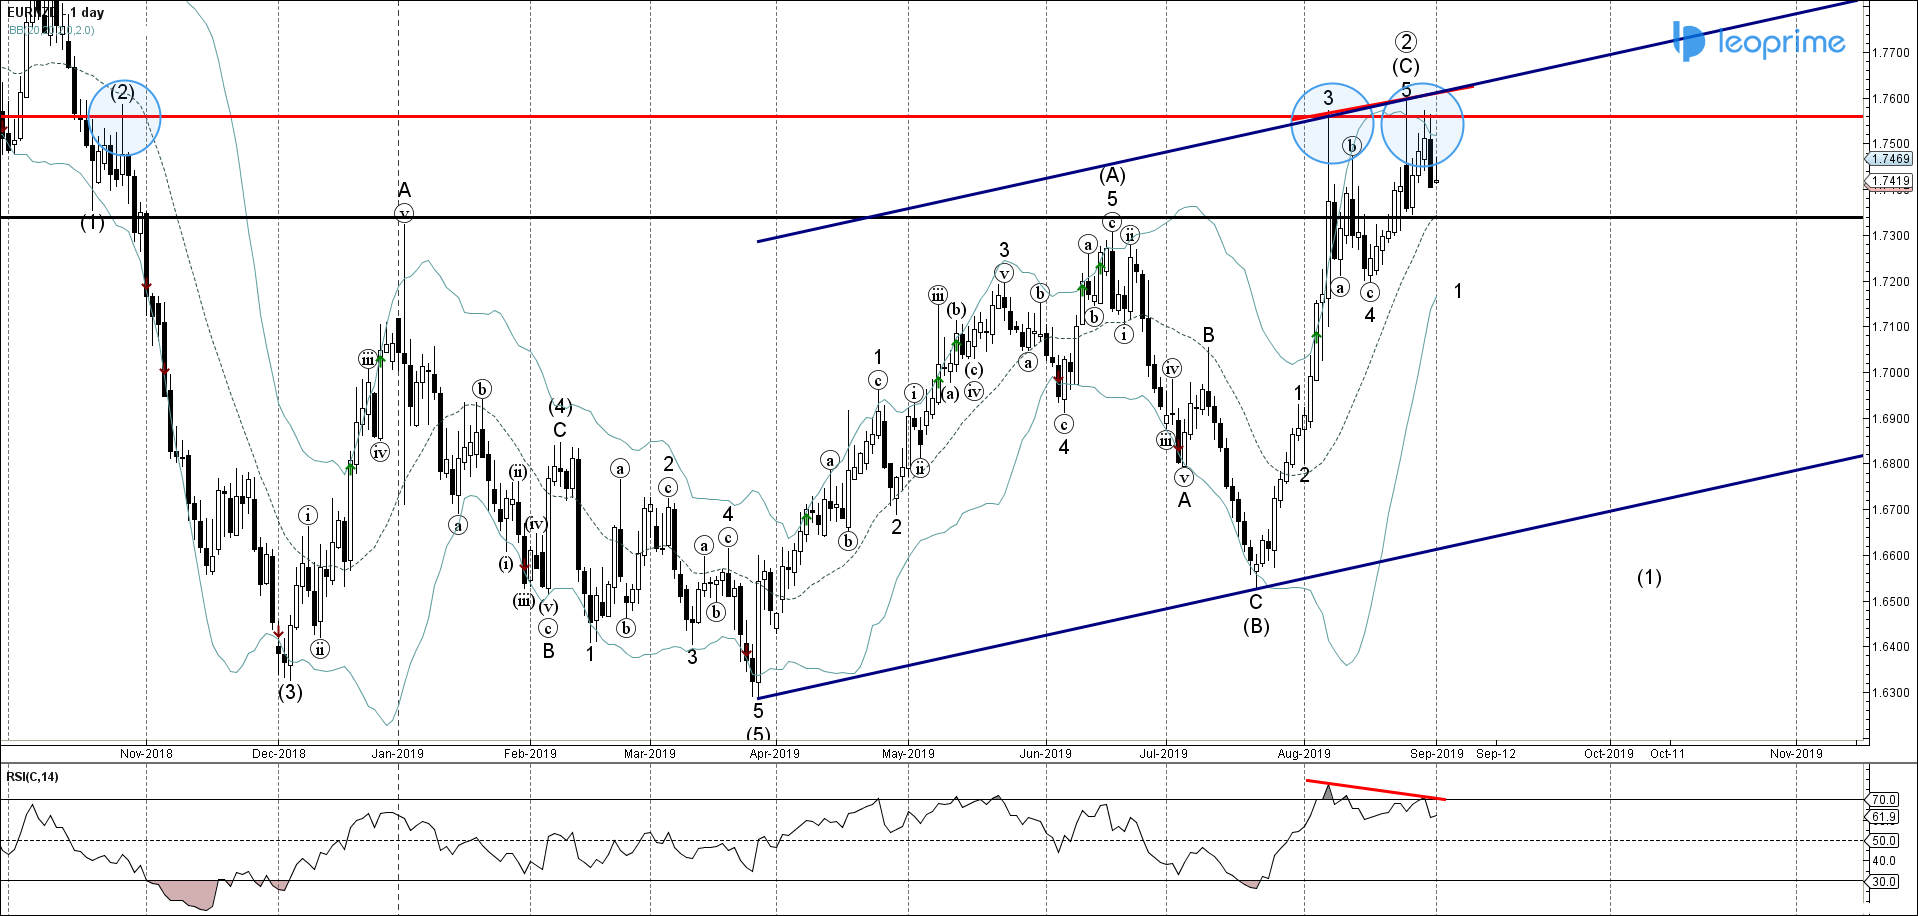
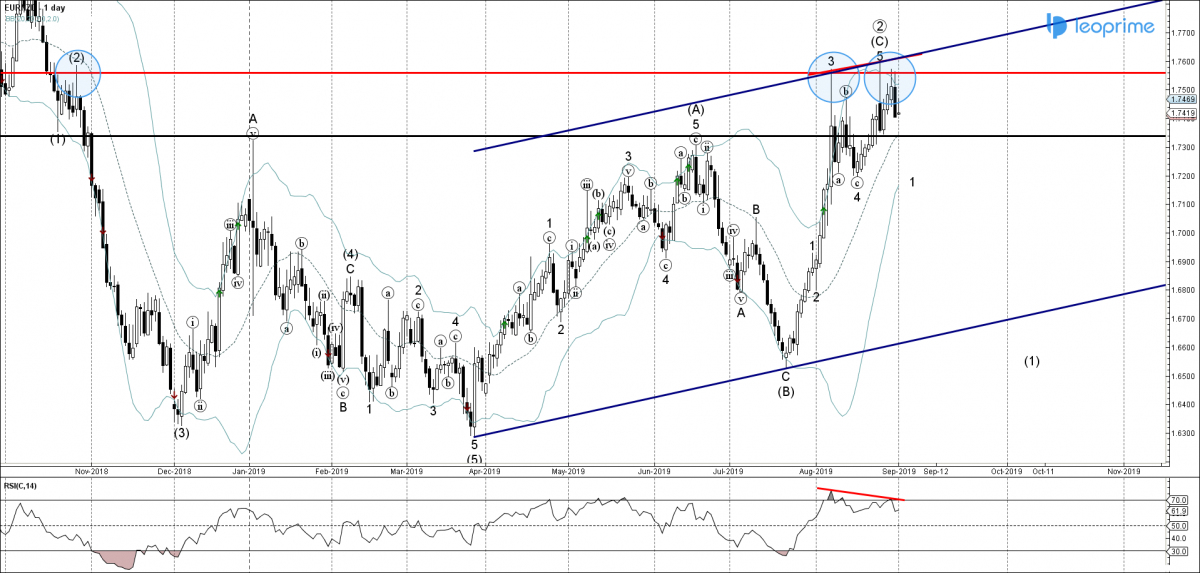
EURNZD recently reversed down with the daily Japanese candlesticks reversal pattern Bearish Engulfing from the combined resistance area lying at the intersection of the following resistance levels – 1.7560 (which has been reversing the price from October of 2018), upper daily Bollinger Band and the resistance trendline of the wide daily up channel from March. Given the bearish divergence seen on the daily RSI indicator – EURNZD is expected to fall further and re-test the next support level 1.7340 (previous reversal pivot from the end of August). If the pair breaks below 1.7340 it is likely to revisit the next key support level 1.730 (former multi-month high from June, top of the previous wave (A)).


