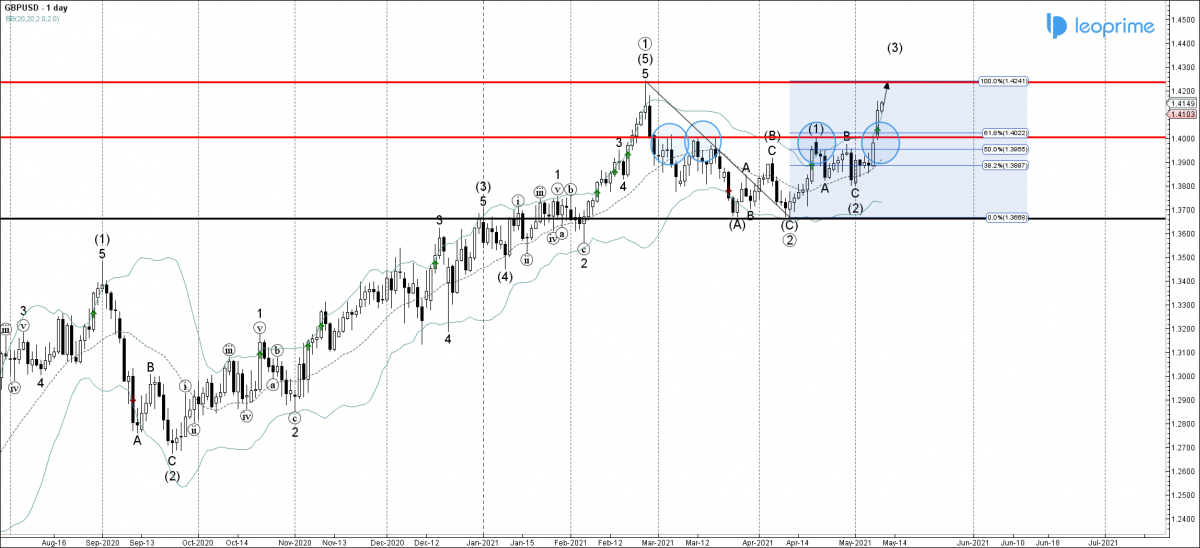
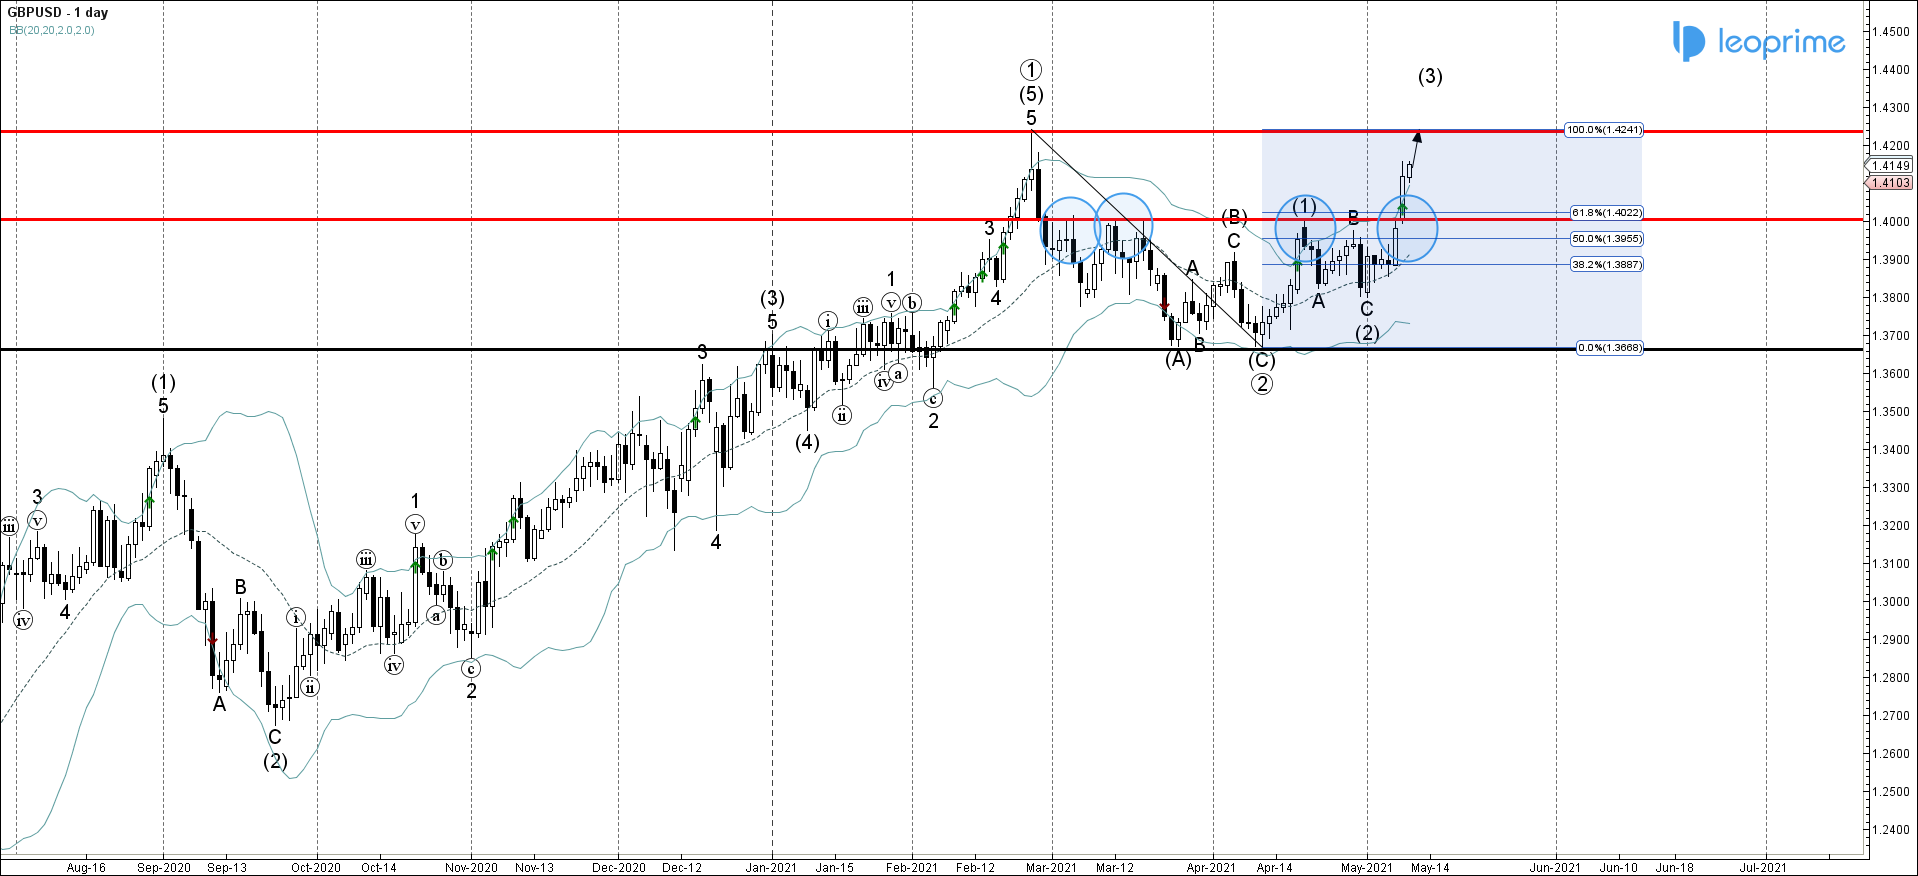
GBPUSD currency pair continues to rise after the earlier breakout of the resistance area located between the round resistance level 1.40000 (which has been reversing the price from the start of March, as can be seen from the daily GBPUSD chart below) and the 61.8% Fibonacci correction of the downward correction from the end of February. The breakout of this resistance area accelerated the active impulse wave (3). GBPUSD can be expected to rise further toward the next resistance level 1.42350 (former multi-month high from the end of February).
GBPUSD broke resistance area. Likely to rise to resistance level 1.42350.


