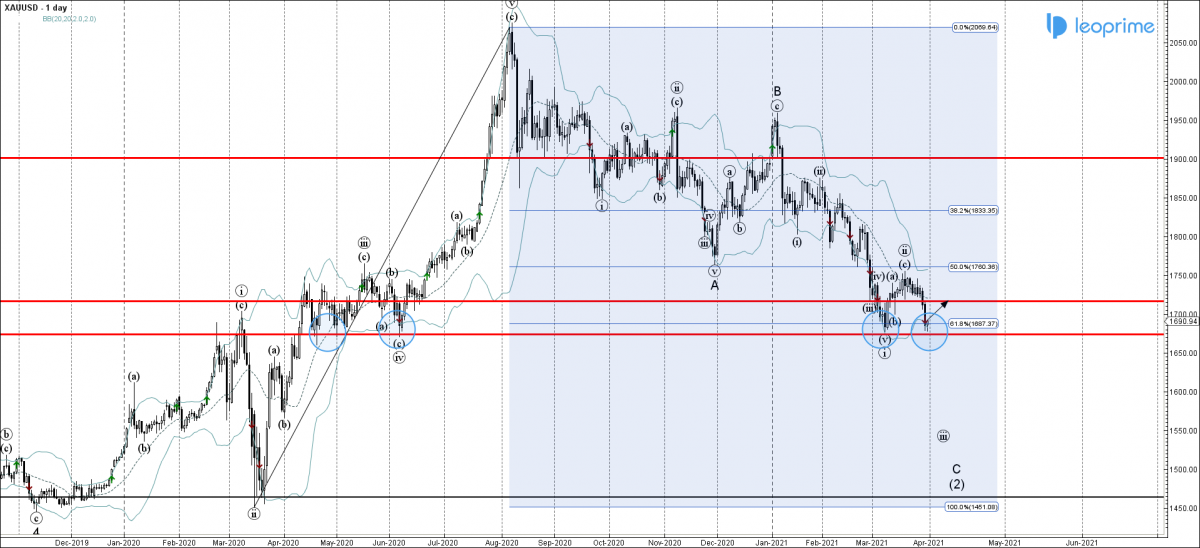
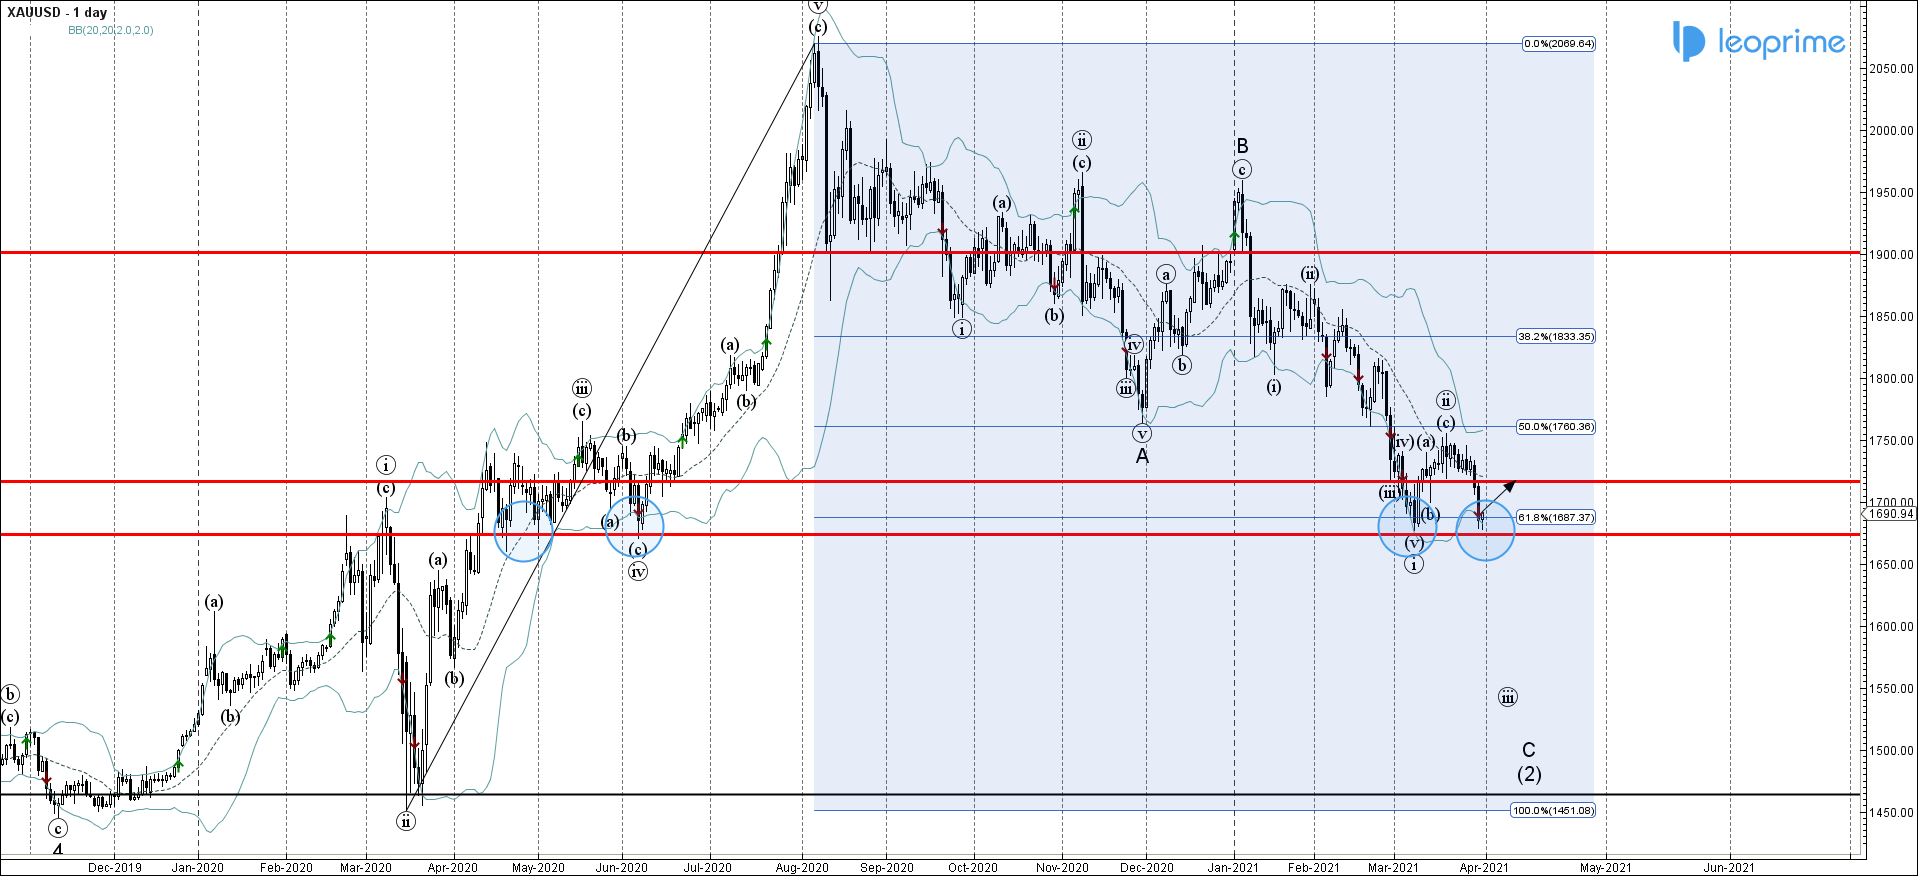
Gold recently corrected up from the support zone located between the powerful long-term support level 1675.00 (which has been reversing the price from April of 2020 as can be seen from the daily Gold chart below) – strengthened by the lower daily Bollinger Band. The upward reversal from this support zone stopped the previous impulse waves (iii) and C. Given the strength of the nearby support level 1675.00 – Gold is expected to rise further toward the next resistance level 1715.00 (former support from the middle of March).
Gold reversed from long-term support level 1675.00. Likely to reach resistance level 1715.00.


