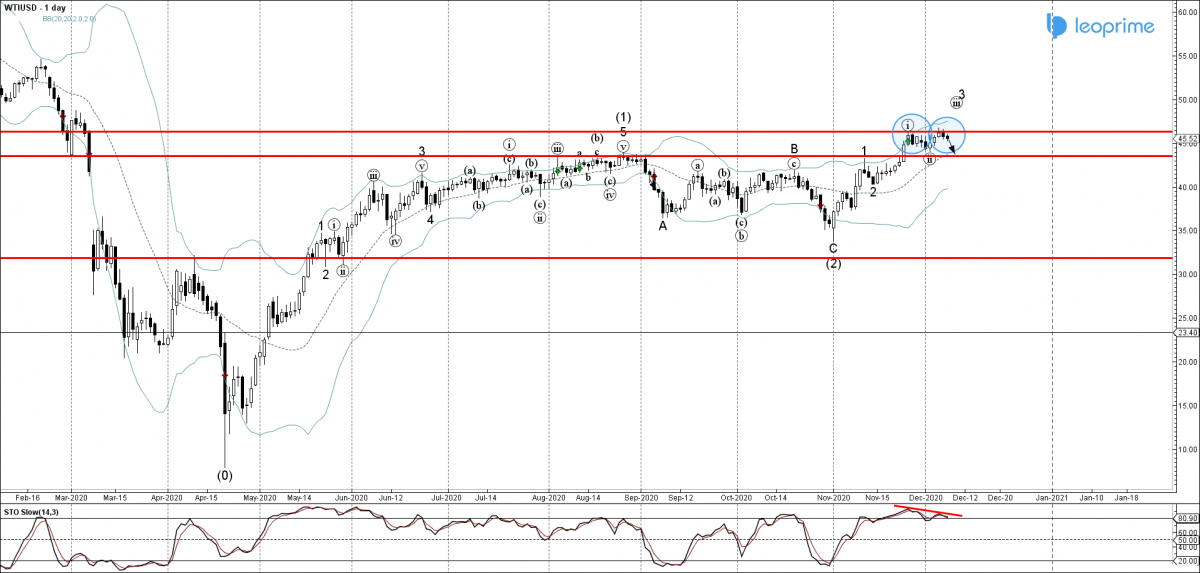
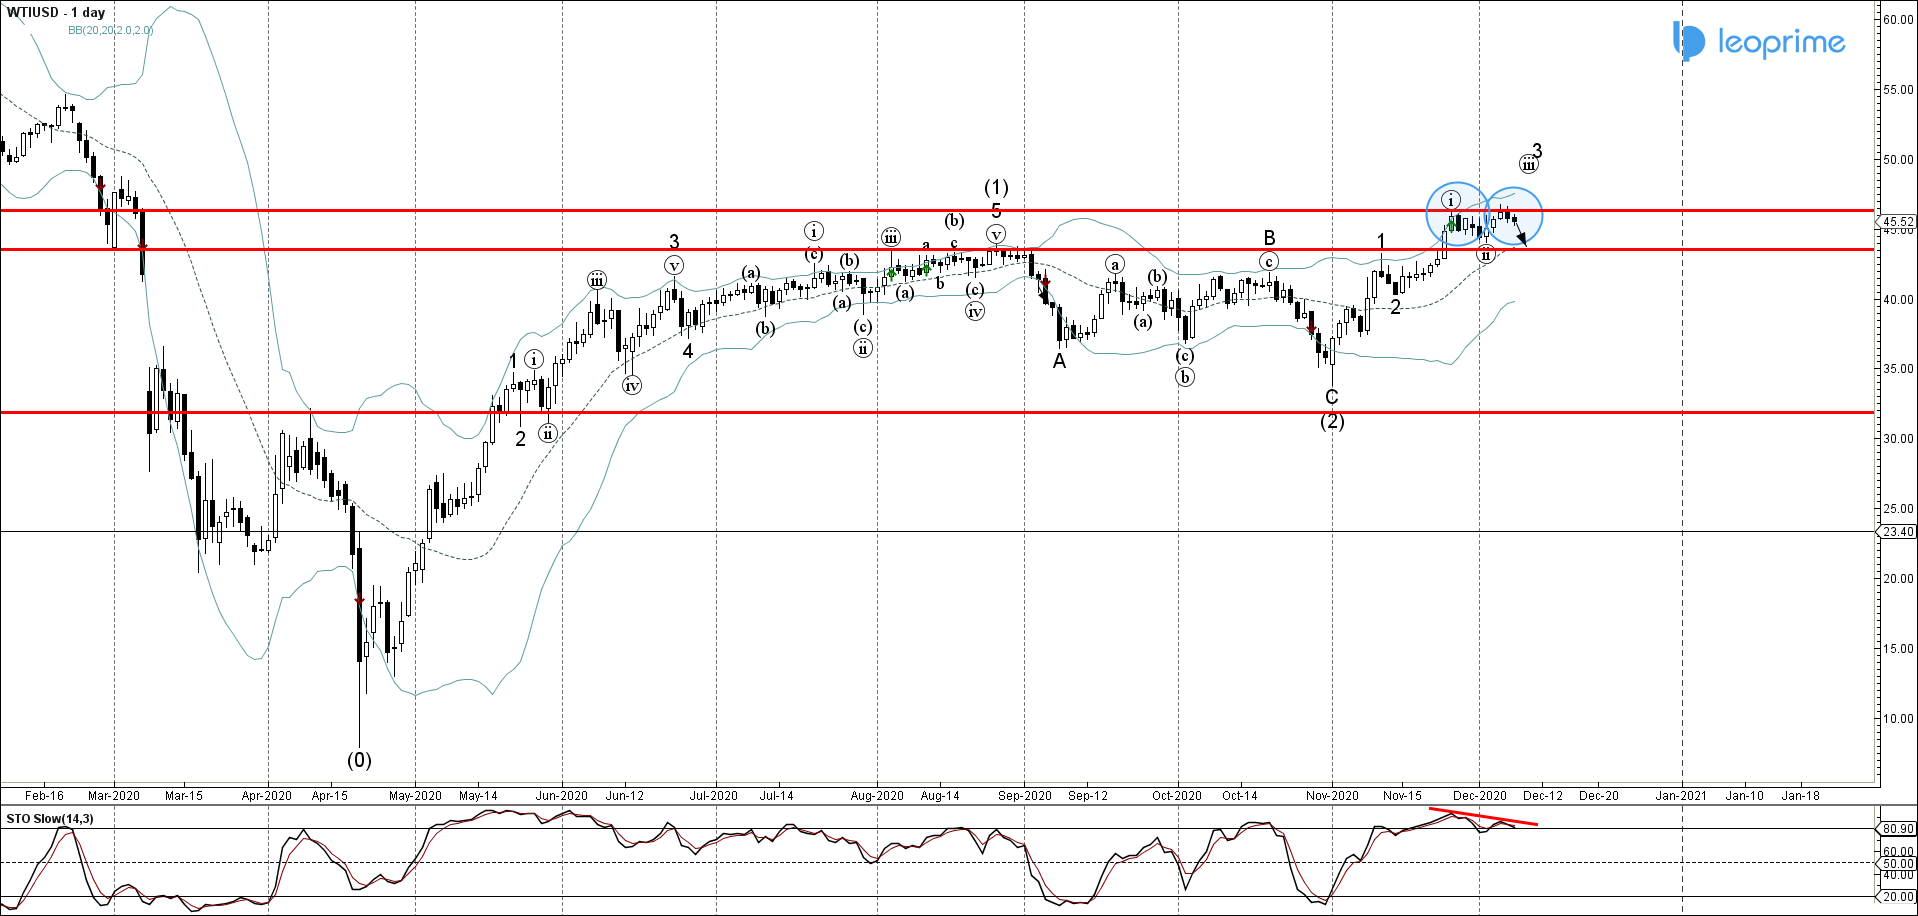
WTI recently reversed down from the resistance level 46.30 (which stopped the previous sharp upward impulse wave (i) at the end of November as can be seen from the daily WTI chart below) – standing near the upper daily Bollinger Band. The downward reversal from the resistance level 46.30 created the daily Japanese candlesticks reversal pattern Bearish Engulfing. Given the overbought reading and the bearish divergence on the daily Stochastic indicator – WTI is expected to fall further toward the next support level 43.55 (former resistance from the start of November).
WTI reversed from resistance level 46.30; Likely to fall to 43.55


