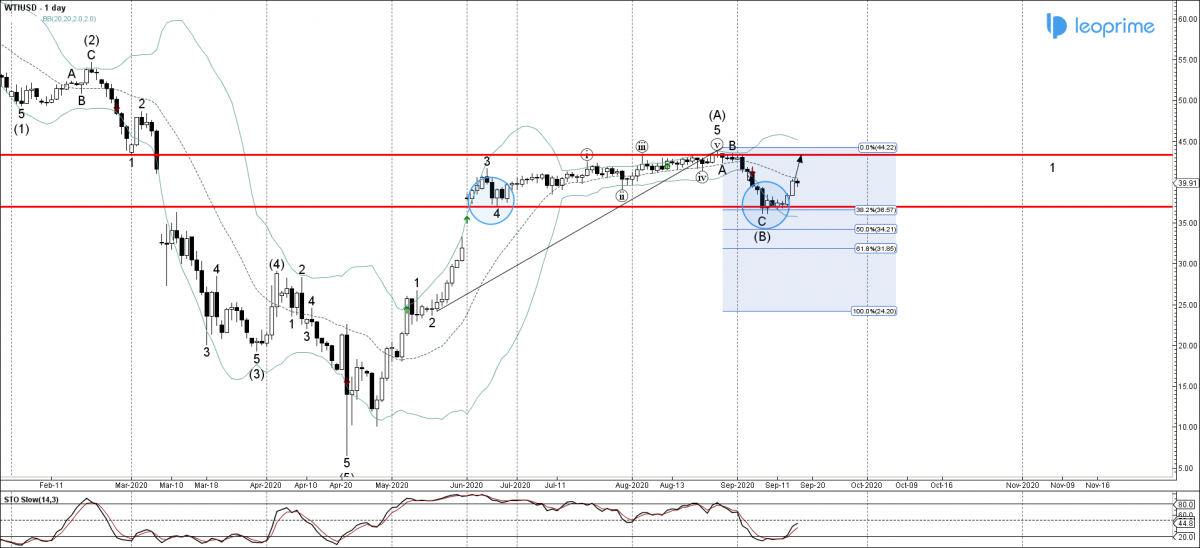
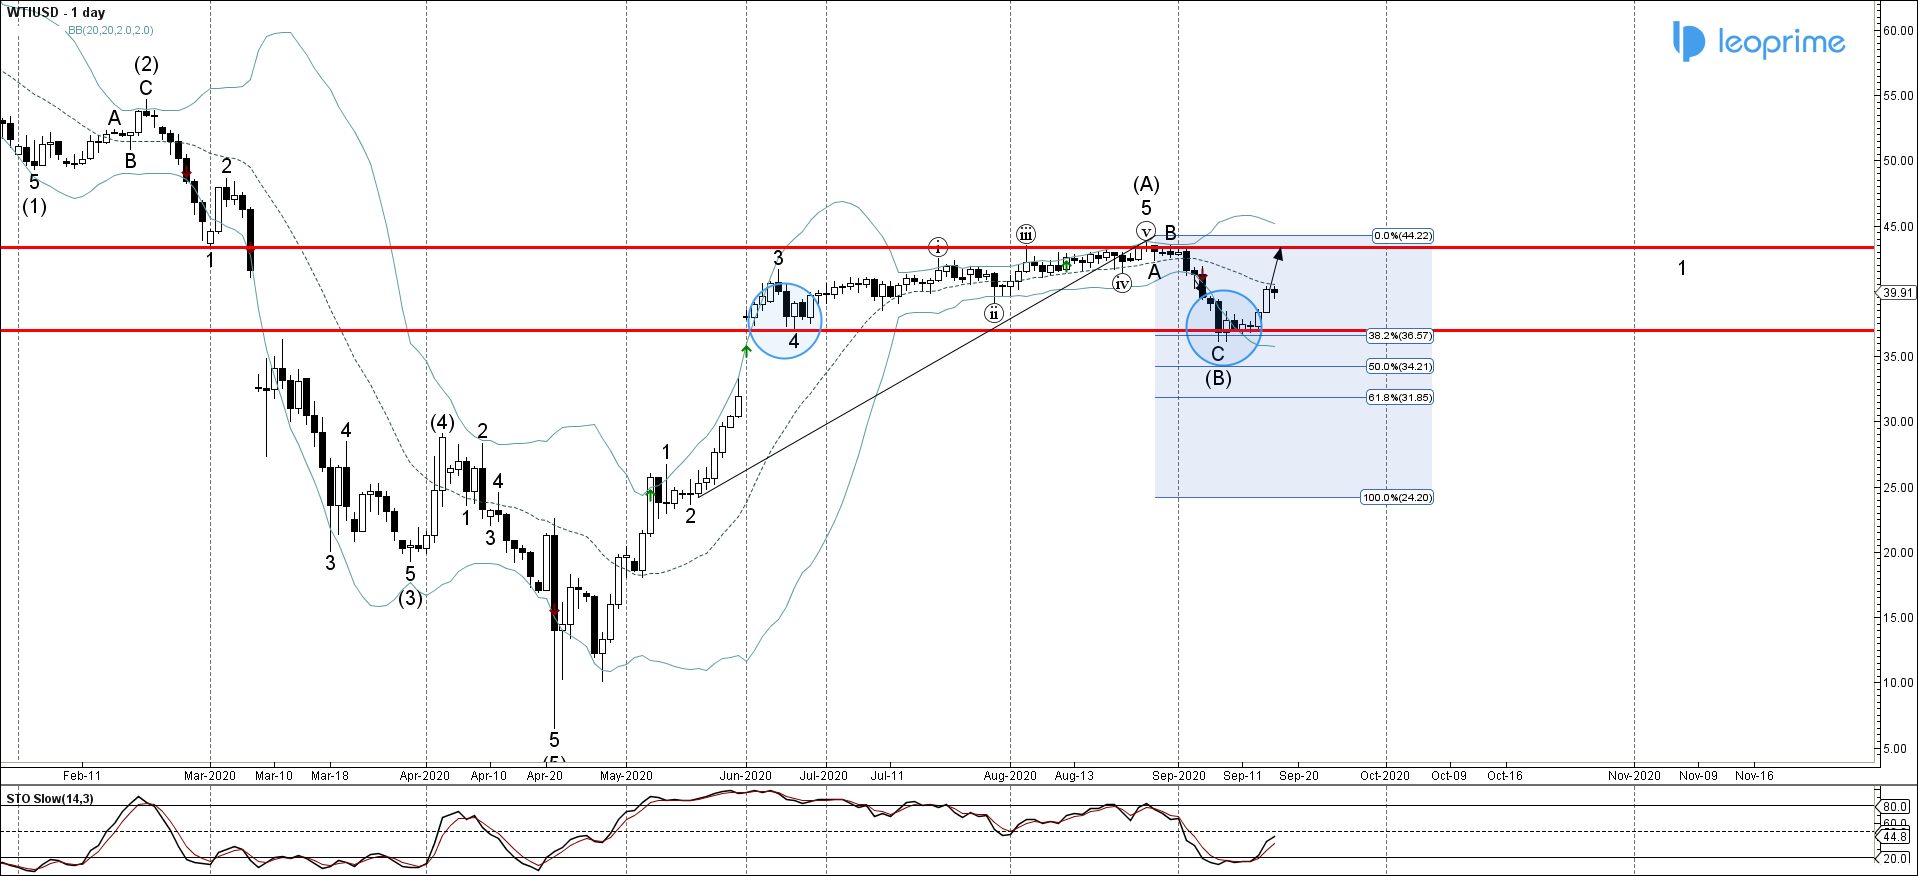
WTI recently reversed up from the support area lying between the key support level 37.000 (which also stopped the previous short-term correction 4 in June), lower daily Bollinger Band and the 38.2% Fibonacci correction of the upward impulse from May. The upward reversal from the aforementioned support area stared the active upward impulse wave (C). Given the clear daily uptrend – WTI is likely to extend the gains toward the next resistance level 43.400 (which stopped the previous waves (A) and B).
WTI reversed from support area; Likely to rise to 43.400


