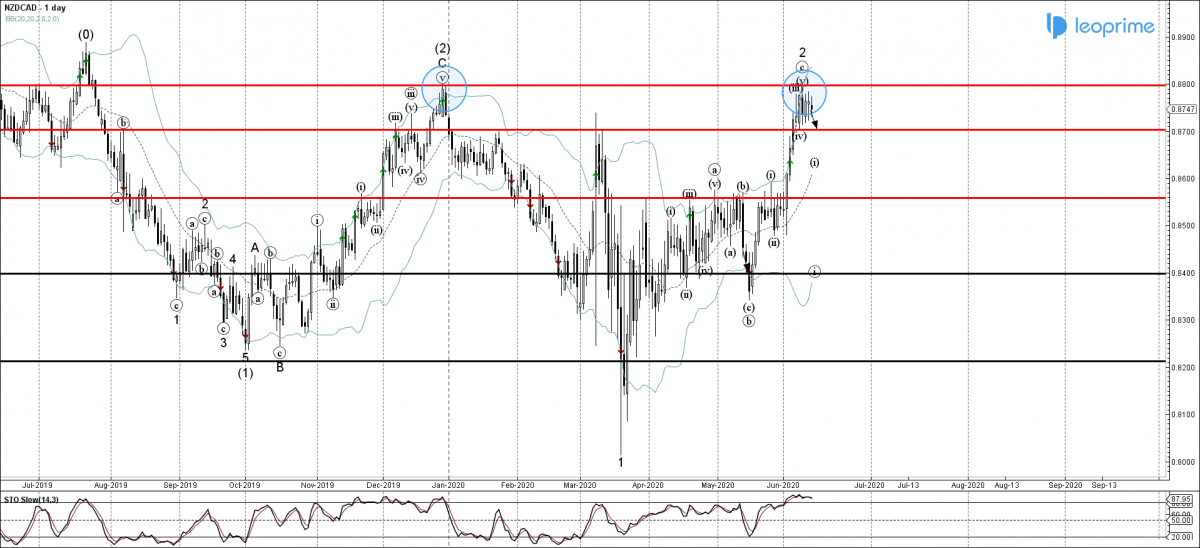
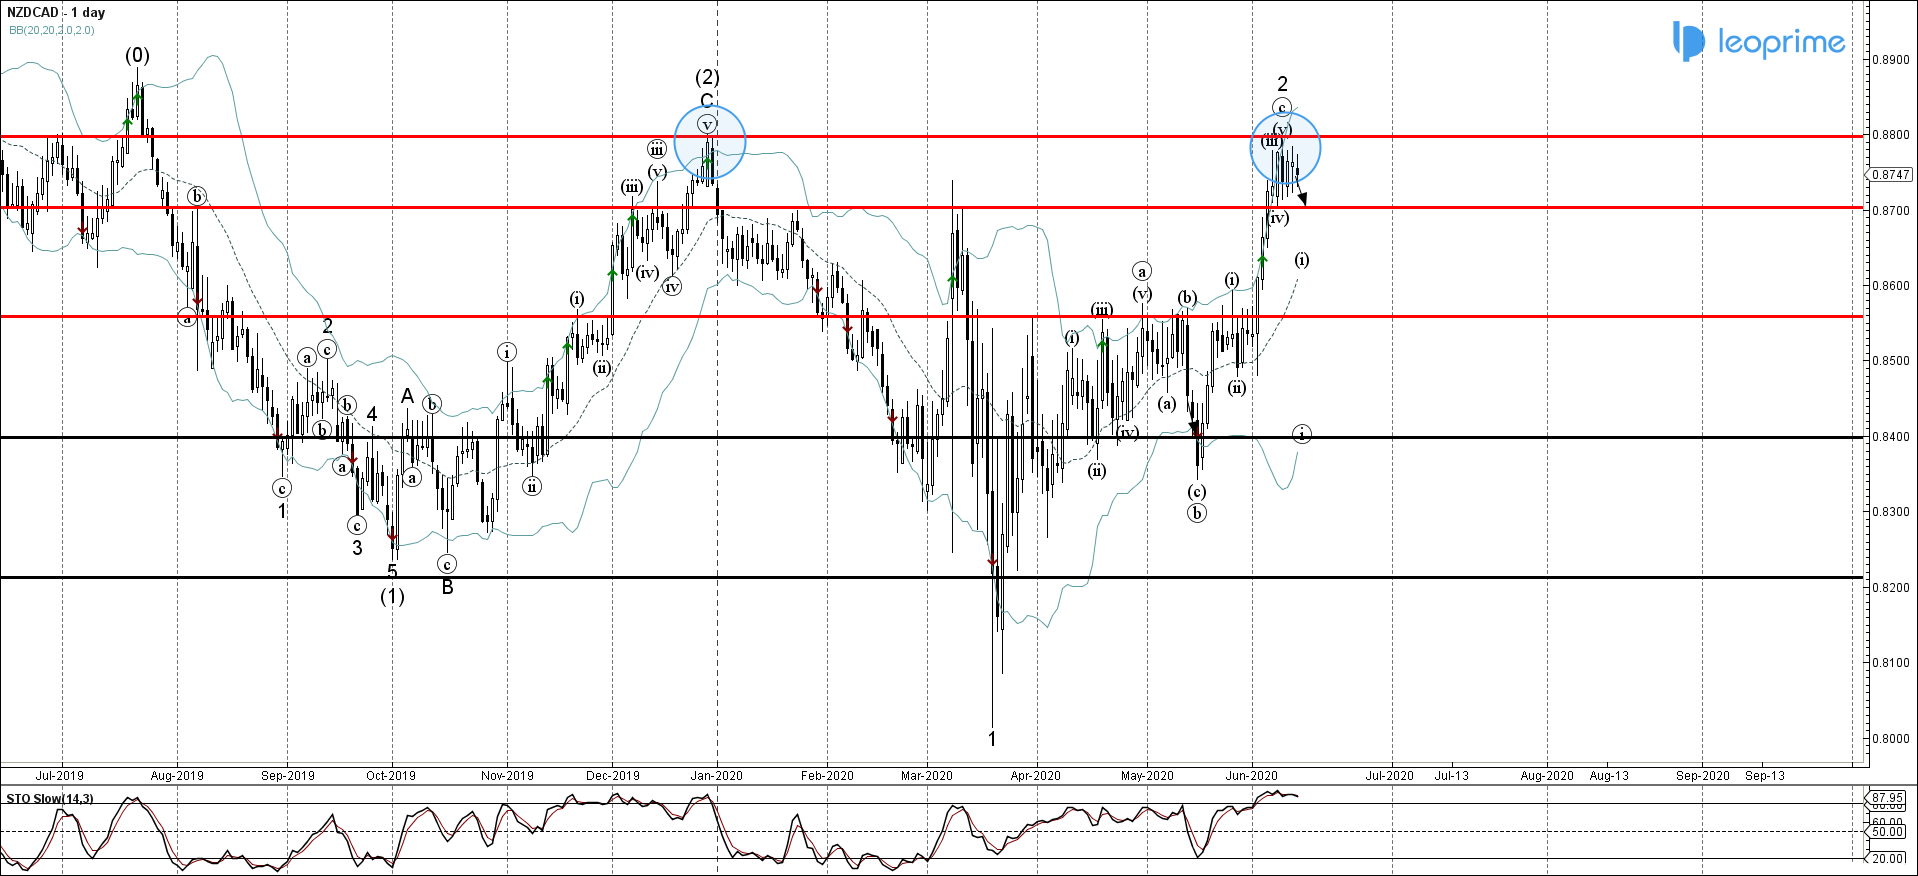
NZDCAD under bearish pressure following the earlier downward reversal from the resistance area lying between the long-term resistance level 0.88000 (which stopped the multi-month uptrend in December of 2019), and the upper daily Bollinger Band. Given the strength of the aforementioned resistance area and the overbought reading on the daily Stochastic indicator – NZDCAD is likely to correct down further toward the next support level 0.87000 (former strong resistance from the start of March).
NZDCAD under bearish pressure; Likely to fall to 0.87000


