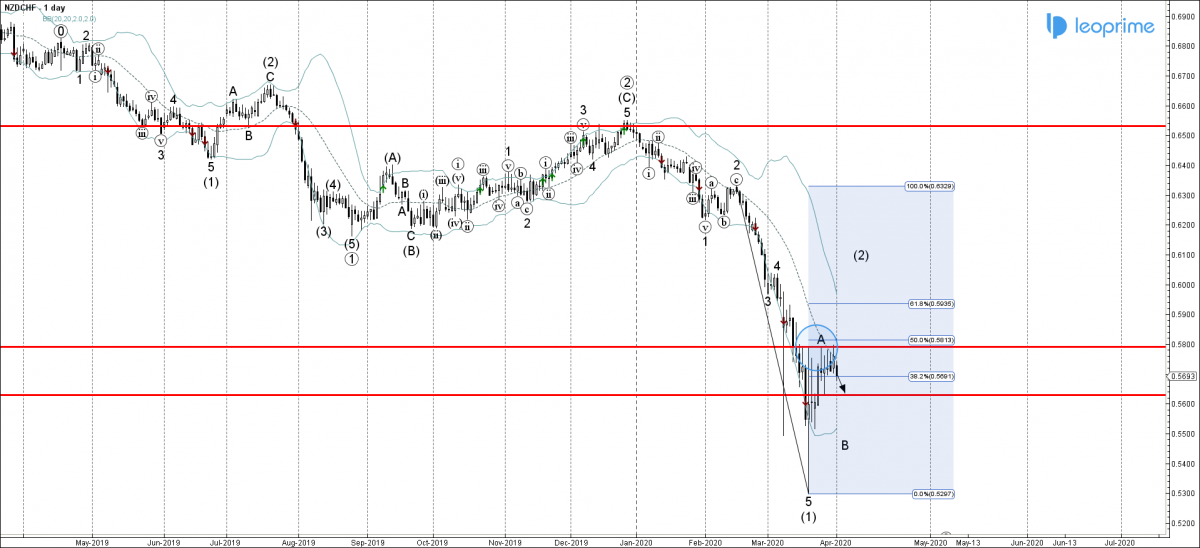
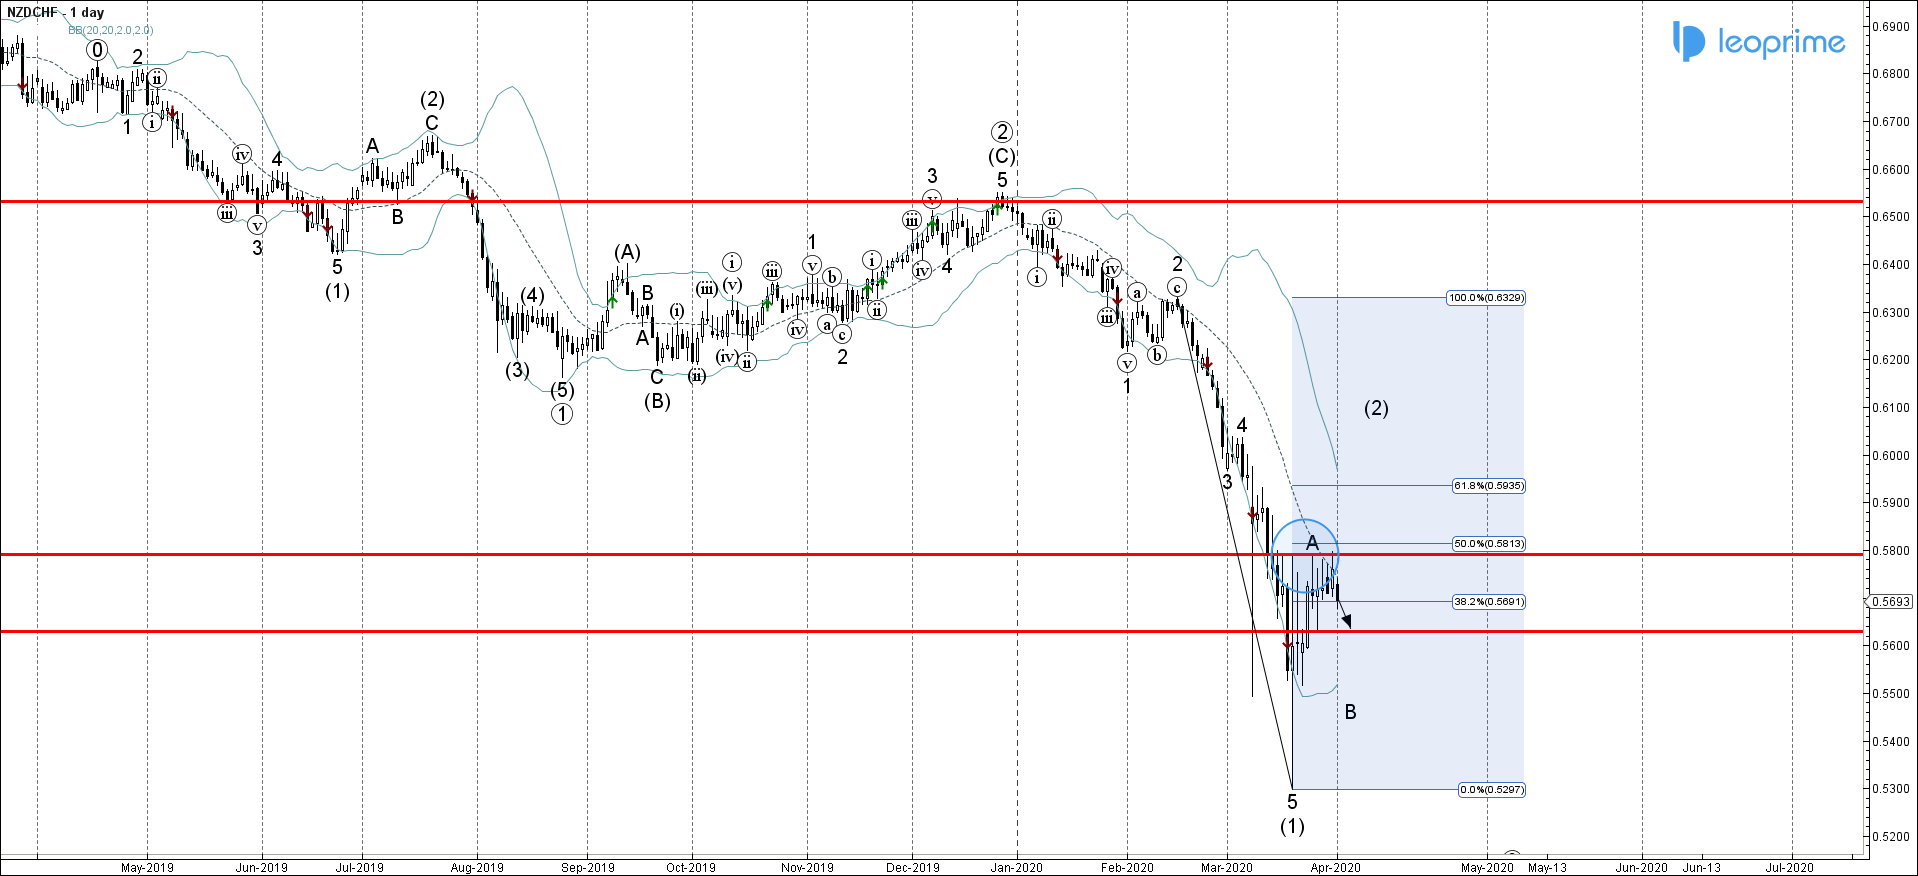
NZDCHF recently reversed down from the resistance area lying between the pivotal resistance level 0.58000 (which has been reversing the price from the middle of March), upper daily Bollinger Band and the 50% Fibonacci retracement of the previous sharp downward impulse from February. The downward reversal from this resistance area started the active wave B. Given the strength of the aforementioned resistance area and the clear weekly downtrend – NZDCHF is likely to fall further toward the next support level 0.56300 (which reversed the price at the end of March).
NZDCHF reversed from pivotal resistance level 0.58000; Likely to fall to 0.56300


