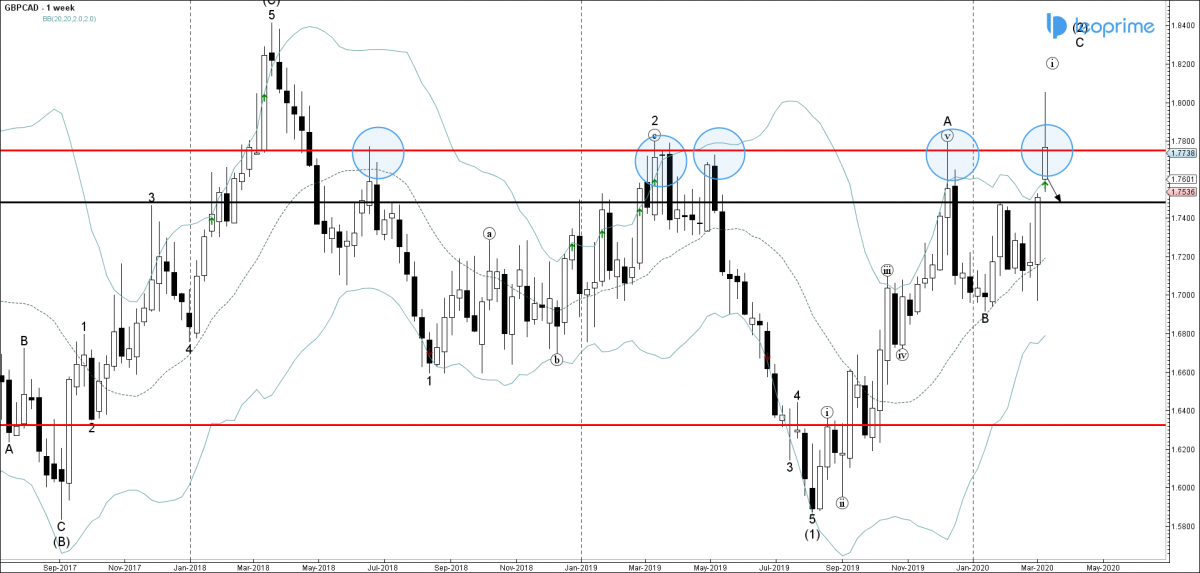
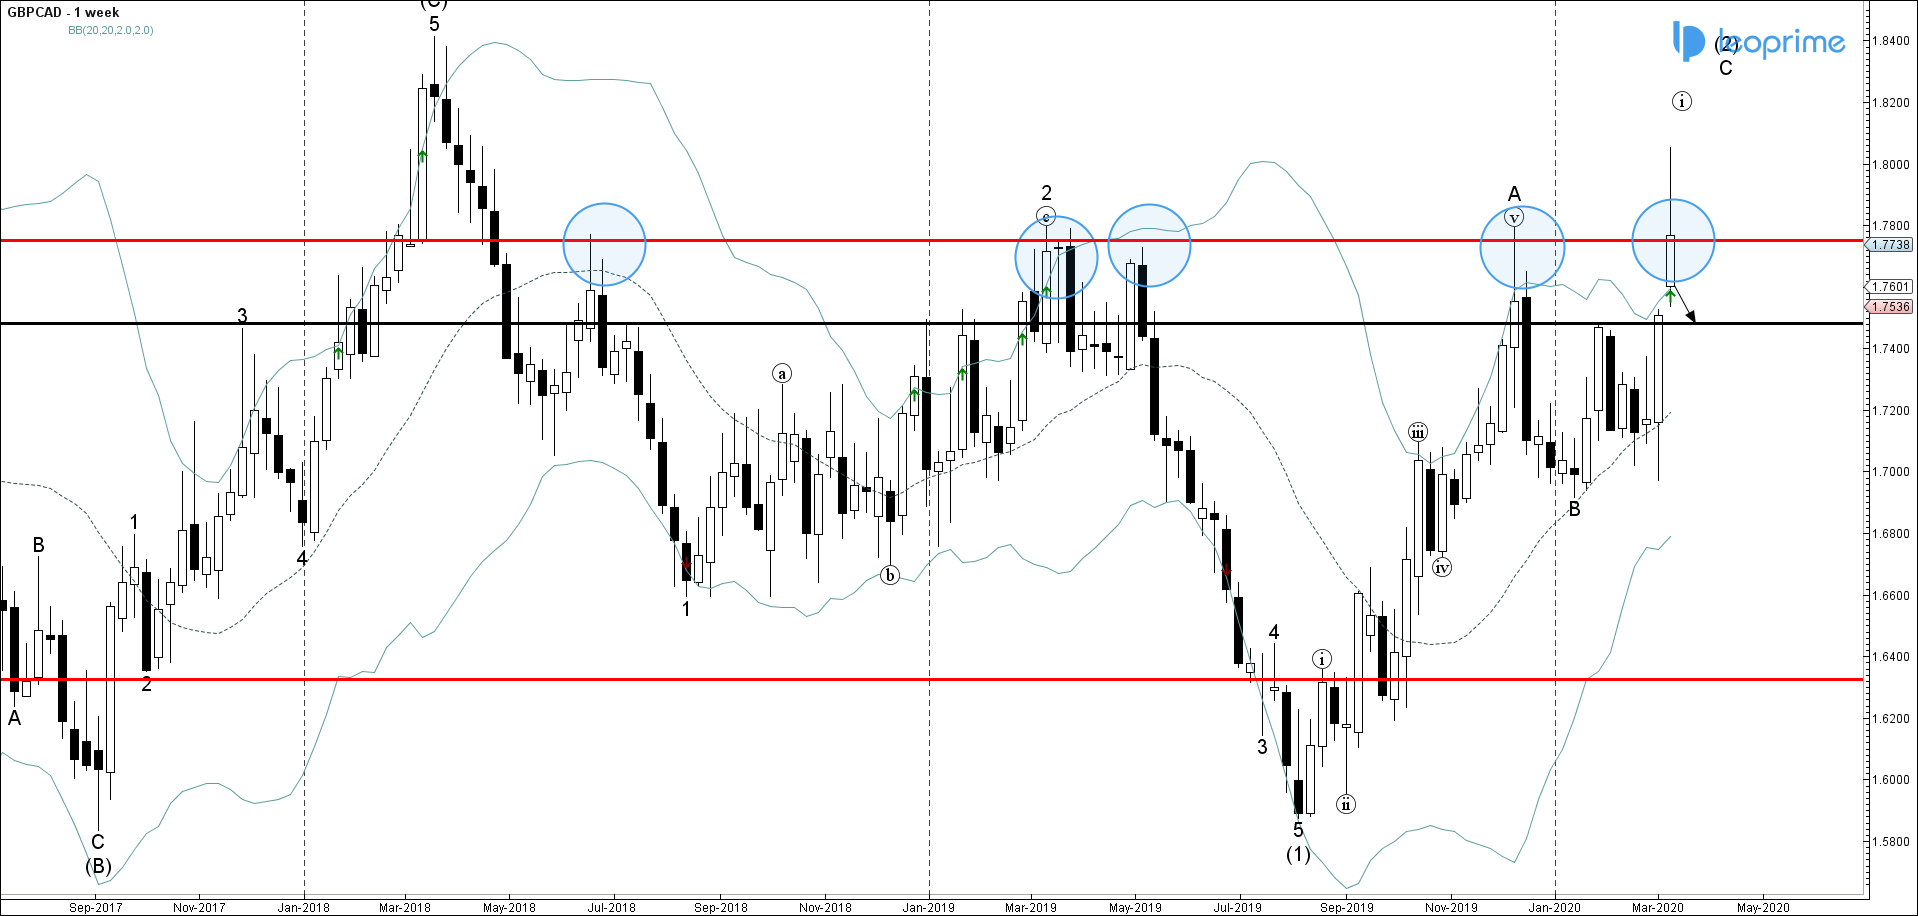
GBPCAD recently reversed down from the resistance area lying between the long-term resistance level 1.77500 (which has been reversing the pair from the middle of 2018, as can be seen from the weekly GBPCAD chart below) and the upper weekly Bollinger Band. The downward reversal from this resistance area stopped the earlier impulse wave C from the start of this year. Given the moderately bearish Sterling sentiment seen across the markets today – GBPCAD is likely to fall further toward the next support level 1.74800 (former monthly high from January
GBPCAD reversed from 1.77500 resistance area; Likely to fall to 1.74800


